When working with data in statistics, it’s not always easy to make sense of a long list of numbers. That’s where class intervals come in. They help us group data into manageable sections so we can see patterns more clearly.


What is a Class Interval?
A class interval is the range of values that belongs to a particular group (or “class”) in a frequency distribution table.
It is calculated as:

For example:
- If one class is 10–20, then

How do you work out the modal class interval?
You can understand the meaning of modal class interval by examining the meaning of each term in the phrase.
Modal means the one that occurs most often (averages: mode). In maths, the mode is one of the most common ways to describe a set of data.
A class interval is the width of one of your groups in the frequency table or, the class interval is what you use when grouping data together.
The modal class is, therefore, the group with the highest frequency.
For example: if you counted the number of pencils in different pencil cases and you decided to group them. You might record how many pencil cases had 1 to 5 pencils in, how many had 6 to 10 pencils in, how many had 11 – 15 pencils, etc, up to whatever number is practical.
In this example, your class intervals are:
- 1 – 5 pencils, 2 pencil cases
- 6 – 10 pencils, 4 pencil cases
- 11 – 15 pencils, 6 pencil cases
- 16 – 20 pencils, 1 pencil case.
If you found that there were more pencil cases with 11 – 15 pencils in than any other class interval, then 11 – 15 is your modal class interval.
What is the modal interval?
Mode refers to a value that is frequently repeated in a data set. In other words, this value occurs more often in a data set. Mode is often used to describe a data set. The width of the group in the frequency table is known as a class interval. The modal interval is a class interval with the highest frequency. For instance, consider the following data set which shows the number of students in a class divided by age group.
| Group | Age group | Number of students |
|---|---|---|
| 1 | 4-5 | 12 |
| 2 | 6-7 | 11 |
| 3 | 8-9 | 6 |
| 4 | 10-11 | 10 |
| 5 | 12-13 | 8 |
| 6 | 14-15 | 4 |
You can see in this table, that the class interval with the highest frequency is 4-5. Hence, this is a modal interval.
What is a modal class in statistics?
Now, we will answer what is modal class in math or statistics.
Modal class in statistics refers to a class having the highest frequency. It refers to a class in which the frequency is the highest in a continuous quantitative statistical variable distribution in which the values are grouped into classes with similar dimensions. The mode is not widely used as a measure of central tendency for continuous quantitative variables because it is more helpful for qualitative variables as mean and median do not make sense in such variables.
To compute the mode of the distribution of grouped data, the middle range of the modal class is used.
How do you calculate modal class?
Modal class is the class interval with the highest frequency. Consider the following example:
| Score range | Number of students |
|---|---|
| 60-65 | 11 |
| 65-70 | 13 |
| 70-75 | 6 |
| 75-80 | 10 |
| 80-85 | 9 |
In the above example, the modal class is 65-70 because it has the highest frequency.
Let us see how we can compute mode for the above grouped data. The formula for mode is given below:
Mode = 
- L is the lower class boundary of the modal class
- fm-1 refers to the frequency of the group before the modal class
- fm refers to the frequency of the modal group
- fm+1 refers to the frequency of the group after the modal group
- w is the width of the class intervals
Substitute the values from the table in the above formula as shown below:
Mode = 

You can also calculate median and mean from the grouped frequency table.
How do you find the class interval?
Consider the following data set which shows the weight of students in a class in kilograms:
55, 45, 48, 56, 69, 48, 54, 55, 45, 53, 55, 58, 62, 65, 68, 70
Follow these steps to define the class interval:
- To find the class interval, which depicts the range of data for each group, the first thing you have to do is to decide how many classes, or groups of data you need. For instance, you have decided that you need 5 classes for data.
- The next step is to work out the difference between the highest and lowest value. The highest weight in the above data set is 70 and the lowest weight is 45. Their difference is 70 - 45 = 25.
- Now, divide this number 25 by 5 to get 5. This means that our class width will be 5.
Using the above steps, we can group the data into different class intervals like this:
| 45-50 | 4 |
|---|---|
| 50-55 | 1 |
| 55-60 | 5 |
| 60-65 | 2 |
| 65-70 | 4 |
How to work out the mean from a grouped frequency table?
Consider the table from the previous question which shows the weight of students in a class:
| 45-50 | 4 |
|---|---|
| 50-55 | 1 |
| 55-60 | 5 |
| 60-65 | 2 |
| 65-70 | 4 |
As this is a grouped data, so we will use the formula to compute the mean of the grouped data. The formula for the mean of the grouped data is given below:
Mean = 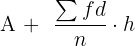
Here:
A = mid value of modal class
n refers to the number of observations
f is the frequency
d =  , where x is the average of the highest and lowest class interval, A is the mid value of the modal class, and h is the number of class intervals.
We will work out f x d for each class interval and take its sum as shown in the table below:
| Class Interval | Frequency (f) | Mid value (x) | d | f x d |
|---|---|---|---|---|
| 45-50 | 4 | 47.5 | -2 | -8 |
| 50-55 | 1 | 52.5 | -1 | -1 |
| 55-60 | 5 | 57.5 = A | 0 | 0 |
| 60-65 | 2 | 62.5 | 1 | 2 |
| 65-70 | 4 | 67.5 | 2 | 8 |
| n = 16 | sum = 1 |
Now, we will substitute the values in the formula to get the value of the mean.
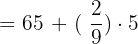
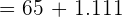
Mean = 
Mean = 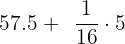
Mean = 

Why are Class Intervals Useful?
- Simplifies data: Instead of dealing with dozens (or hundreds) of individual numbers, data is grouped into ranges.
- Reveals patterns: It becomes easier to spot trends, such as which range of values is most common.
- Helps in graphing: Histograms and frequency polygons rely on class intervals to organize the data visually.
1. Find the range of the data:
2. Decide how many classes you want: Usually between 5 and 20 depending on the size of your dataset.
3. Divide the range by the number of classes: 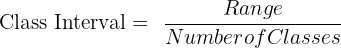
Practice Questions & Solutions
The ages of 10 students are:
{12, 15, 14, 13, 16, 17, 12, 18, 14, 15}
a) Find the range of the data.
b) If we want 4 classes, calculate the class interval.
Range = 18 − 12 = 6
Class Interval = 6 ÷ 4 = 1.5 → round up to 2
The marks scored by students in a test are:
{22, 35, 41, 28, 33, 48, 37, 44, 31, 39}
a) Find the range.
b) If we create 5 classes, what is the class interval?
Range = 48 − 22 = 26
Class Interval = 26 ÷ 5 = 5.2 → round up to 6
The heights (in cm) of 12 basketball players are:
{168, 172, 189, 175, 181, 177, 184, 190, 169, 173, 180, 176}
a) Find the range.
b) If we want 6 classes, what is the class interval?
Range = 190 − 168 = 22
Class Interval = 22 ÷ 6 ≈ 3.67 → round up to 4
*Extended Practice*
The following data are weights (kg) of people on a diet plan:
{52, 75, 92, 101, 83, 68, 133, 78, 104, 61, 39, 46, 135, 87, 131, 99, 104, 86, 67, 116, 89, 57, 87, 98, 131, 116, 135, 93}
a) Find the range of the data.
b) With a class interval of 14, determine how many classes you get.
c) Present these weights in a frequency distribution table.
Range = 135 − 39 = 96
Number of classes = 96 ÷ 14 ≈ 6.9 → 7 classes
| Class Interval | Frequency |
|---|---|
| 39–52 | 2 |
| 53–66 | 3 |
| 67–80 | 4 |
| 81–94 | 7 |
| 95–108 | 5 |
| 109–122 | 2 |
| 123–136 | 5 |
Key Takeaway
The class interval is simply the width of each group when organizing data into classes. It is essential in statistics for creating frequency tables, histograms, and understanding data trends.
Summarise with AI:
Did you like this article? Rate it!


How many class interval is there between 1 to 86
Hi Hritam,
That depends on how wide each class interval is.
The number of class intervals = Range/Class interval width
where
Range = Highest value – Lowest value = 86-1= 85
Class interval width = whatever size you choose (e.g., 5, 10, etc.).
For example:
If the interval size is 5 → 85÷5=17 intervals.
I like it please continue to teach me I’m a student
Not good better learn you only
for a set of raw data with the range of 99, how many class intervals could be formed if the class size is 10
Need help
With a class interval of 14, determine how many classes you will get from given list of midterm scores received by 50 students in a programming class:
45, 85, 92, 99, 37, 68, 67, 78, 81, 25,
97, 100, 82, 49, 54, 78, 89, 71, 94, 87,
21, 77, 81, 83, 98, 97, 74, 81, 39, 77,
99, 85, 85, 64, 92, 83, 100, 74, 68, 72,
65, 84, 89, 72, 61, 49, 56, 97, 92, 82