
When it comes to personal finance, Excel is the perfect tool to help you get a handle on finances and accounting for your household or small business! It’s more cost-effective than some other budgeting options and gives you more control over how to set up your documents.
With its powerful formulas and user-friendly interface, Excel offers a fantastic platform for creating and managing personal budget spreadsheets through automated calculations and organisation. 1
In this article, we will learn more about budgeting and accounting using Excel financial formulas so you can start keeping track of your money efficiently and effectively!
| Formula | Purpose | Example | What It Does |
|---|---|---|---|
| SUM | Calculate the total of a range of values | =SUM(B2:B20) | Adds all numbers in cells B2 through B20, making it ideal for calculating total income, expenses, or savings. |
| AVERAGE | Find the average value | =AVERAGE(C2:C13) | Calculates the mean of the values in C2:C13, helping you determine your average monthly or weekly spending. |
| IF | Display different results based on a condition | =IF(B5>C5,"Over budget","On track") | Compares actual spending (B5) with the budget (C5) and displays "Over budget" if spending exceeds the budget, otherwise "On track". |
| SUMIF | Add values that meet one condition | =SUMIF(A2:A10,"Groceries",C2:C10) | Sums only the amounts in column C where the corresponding category in column A is "Groceries". |
| TODAY | Return the current date | =TODAY() | Automatically displays the current date and updates every day when the workbook is opened or recalculated. |
| MONTH | Extract the month from a date | =MONTH(A2) | Returns the month number (1–12) from the date in cell A2. For example, 1‑Jul‑2026 returns 7. |
| YEAR | Extract the year from a date | =YEAR(A2) | Returns the year from the date in cell A2. For example, 1‑Jul‑2026 returns 2026. |
| DATE | Create a valid Excel date | =DATE(2026,3,1) | Generates a date value that Excel recognises, making formulas more reliable than typing dates as text. |


🔢 Fundamental Budgeting Formulas
Let's start with the basics of budgeting formulas, involving easy, automated, and repetitive calculations. They answer simple, straightforward questions such as:
- How much have I spent this month?
- What is my average monthly spending?
- Am I over budget for the past three months?
☑️ SUM Function for Totalling Any Figures
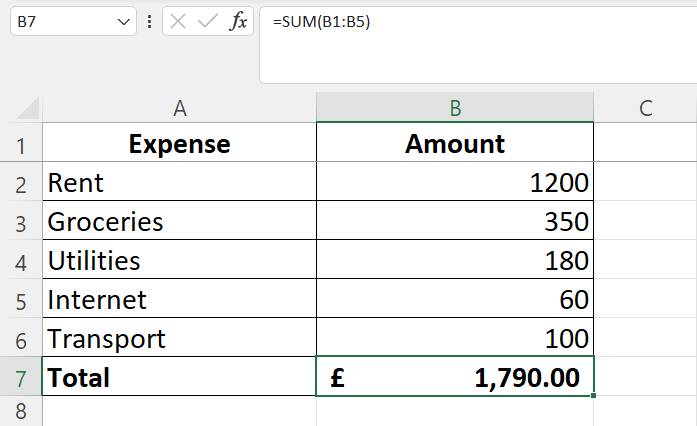
The SUM function helps you to add any given numbers automatically for the following purposes:
The formula used is =SUM(B2:B5), where it sums the values that you input from cells B2 and B5.
☑️ AVERAGE Function for Determining Mean Expenditure
Next, let's explore how the AVERAGE formula works.
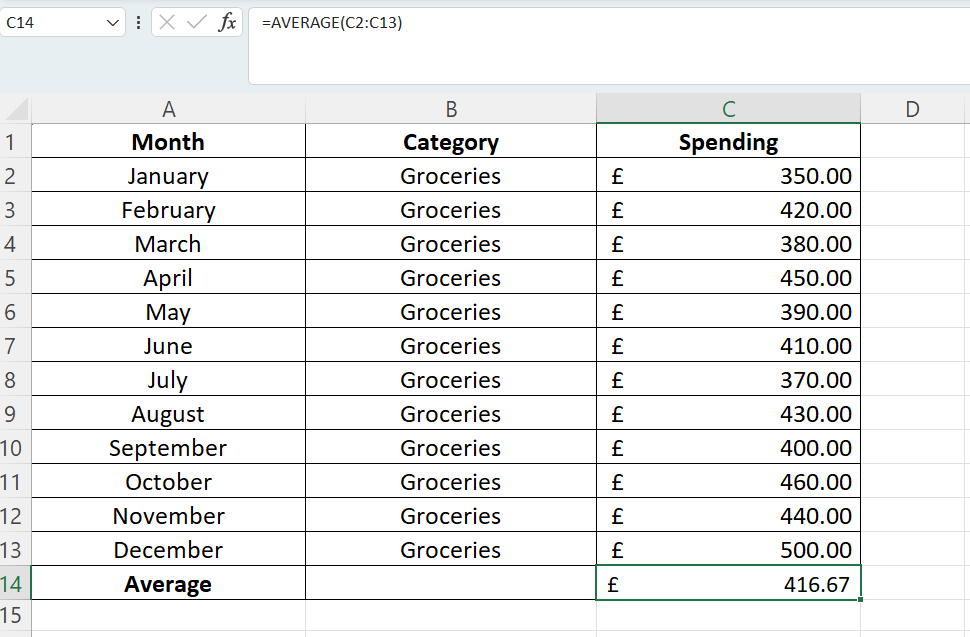
In terms of budgeting, this formula helps you to calculate the typical monthly spending (using the arithmetic mean of selected values) without being influenced by major fluctuations. It offers a realistic estimate of your future spending based on an average of twelve months. You can use this formula for these purposes:
The formula used is =AVERAGE(C2:C13), and it calculates the average of all values between C2 and C13.
☑️ IF Statements for Budget Alerts
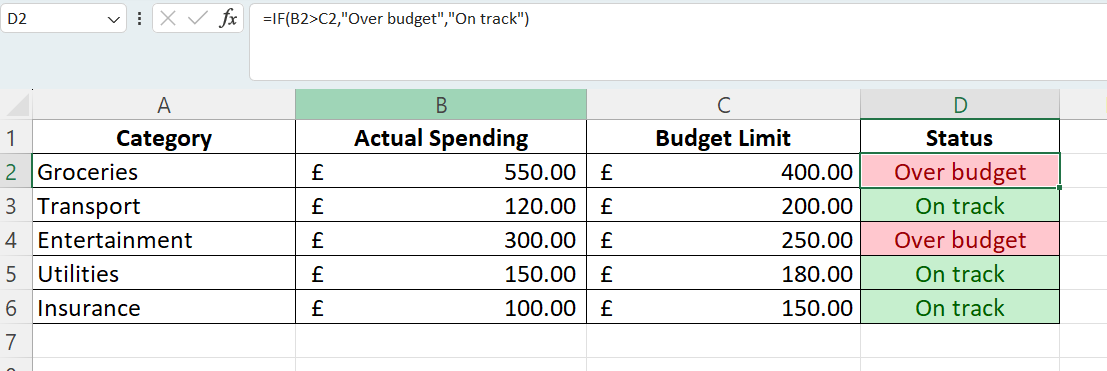
One of the most useful Excel formulas for personal budgeting is certainly the IF function. It helps to create automatic budget alerts if it detects that your spending exceeds the budgeted amounts.
We want Excel to compare:
- Column B = Actual Spending
- Column C = Budget Limit
The formula used is =IF(B2>C2,"Over budget","On track"). Once you type the formula in Column D, it will indicate whether your spending has exceeded your budget or not for the particular category.
Don't forget to check out these Excel tips and tricks that you can apply in your budgeting!
🔎 Advanced Budgeting Formulas
Advanced budgeting formulas go beyond automated calculations. They help you to filter and categorise your calculations and answer more specific questions such as:
- How much did I spend on groceries alone?
- How much did I spend on groceries this month?
- How much have I spent on utilities this year?
These formulas are pivotal in sorting out dozens or hundreds of transactions (especially for a family budget) in your Excel spreadsheet, telling you where and when you spent the money!

✅ SUMIF and SUMIFS for Conditional Totals
Both SUMIF and SUMIFS help you total values based on specific conditions, such as date ranges or categories.
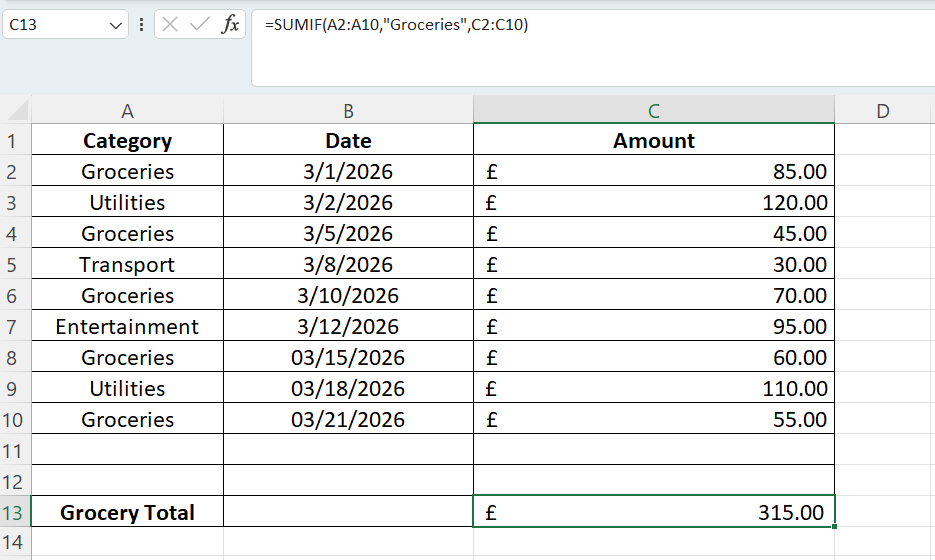
Case example: Using SUMIF to determine only your total grocery spending. The Excel formula used is =SUMIF(A2:A10,"Groceries",C2:C10)
| Part | Meaning |
|---|---|
| A2:A10 | Look through these cells for a sppecific category |
| "Groceries" | Find row where the category is Groceries |
| C2:C10 | Add the corresponding amounts from this column. |
In this example, Excel searches the Category column for "Groceries" and sums the corresponding values in the Amount column, returning a total grocery spend of $315.
On the other hand, the SUMIFS Excel formula takes a step further by evaluating multiple criteria simultaneously. Case example: Using SUMIFS to find out how much you spend on groceries in March 2026.
- The Excel formula used is =SUMIFS(C2:C13, A2:A13,"Groceries", B2:B13,">="&DATE(2026,3,1), B2:B13,"<"&DATE(2026,4,1)).
| Formula Part | What It Does |
|---|---|
| SUMIFS | Tells Excel to sum values that meet multiple conditions. |
| C2:C13 | The Amount column. These are the numbers Excel will add together. |
| A2:A13 | The Category column that Excel checks first. |
| "Groceries" | The first condition. Only rows where the category is Groceries are included. |
| B2:B13 | The Date column that Excel checks next. |
| ">="&DATE(2026,3,1) | The second condition. Include only transactions on or after 1 March 2026. |
| B2:B13 | Excel checks the Date column again for another condition. |
| "<"&DATE(2026,4,1) | The third condition. Include only transactions before 1 April 2026, effectively limiting the results to March 2026. |
In this example, Excel adds only the expenses categorised as Groceries that occurred between 1 March and 31 March 2026, ignoring purchases from other categories or months.
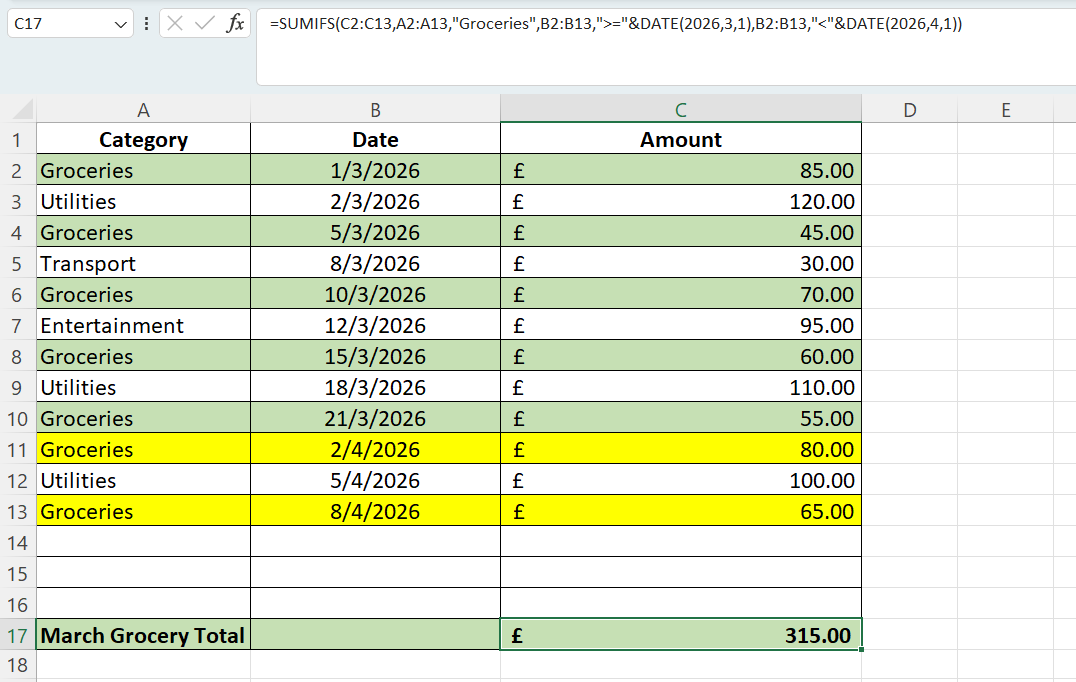
SUMIFS is ideal for generating detailed financial reports and analysing spending over specific periods. Source: Screenshot of Excel for SUMIFS formula✅ Using TODAY(), MONTH(), and YEAR() for Dynamic Date References
If you want to review your budget according to a specific timeline, you can use these TODAY(), MONTH(), and YEAR() formulas.
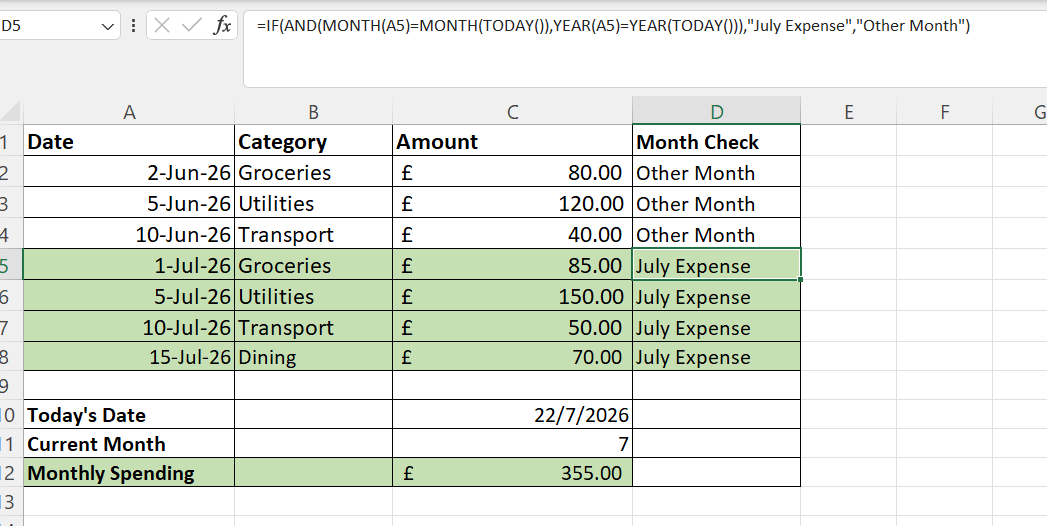
For example, you can use Excel to identify which transactions belong to the current month, which is July 2026.
- The formula used is =IF(AND(MONTH(A5)=MONTH(TODAY()),YEAR(A5)=YEAR(TODAY())),"July Expense","Other Month")
| Part | Meaning |
|---|---|
| IF | Tells Excel: "If this condition is true, show one result. If it is false, show another." |
| AND | Checks whether all conditions are true; every condition inside AND must pass. |
| MONTH(A5) | Extracts the month number from the date in A5. |
| MONTH(TODAY()) | Extracts the current month number from today's date. |
| MONTH(A5)=MONTH(TODAY()) | Compares the transaction month with the current month; returns TRUE or FALSE. |
| YEAR(A5) | Extracts the year from the date in A5. |
| YEAR(TODAY()) | Extracts the current year from today's date. |
| YEAR(A5)=YEAR(TODAY()) | Checks if the transaction happened in the same year as today; TRUE or FALSE. |
| AND(MONTH(A5)=MONTH(TODAY()) | YEAR(A5)=YEAR(TODAY())) |
| July Expense | Text shown when the IF test is TRUE. |
| Other Month | Text shown when the IF test is FALSE. |
Here's an overview that shows only transactions in July.
Explore other custom functions in Excel and learn how to use them.
⚙️ Building a Simple Budget Template in Excel
There's one rule of thumb if you want to apply the above Excel formulas seamlessly. You need to have a well-organised spreadsheet template with consistent categories and columns.
💰 Setting Up Income and Expense Categories
Start by setting up your income and expense categories to make it easier to analyse your finances and calculations.
Income
- Salary
- Freelance income
- Investments
- Bonuses
Expenses
- Housing
- Utilities
- Groceries
- Transport
- Dining
- Entertainment
- Insurance
- Healthcare Savings

Here's an overview of the template that you can try out in your Excel spreadsheet.
| Date | Description | Category | Income | Expense |
|---|---|---|---|---|
| 1-Jul-2026 | Salary | Income | $3,500 | |
| 2-Jul-2026 | Rent | Housing | $1,200 | |
| 5-Jul-2026 | Supermarket | Groceries | $85 | |
| 8-Jul-2026 | Electricity Bill | Utilities | $120 |
🔄 Applying Formulas to Automate Calculations
Once you have organised your categories, you can start using the formulas to analyse and calculate your financial transactions according to your preferences.
| Formula | Purpose |
|---|---|
| =SUM(E2:E20) | Calculate total expenses |
| =AVERAGE(E2:E20) | Calculate average spending |
| =SUMIF(C:C,"Groceries",E:E) | Total grocery expenses |
| =IF(E5>F5,"Over budget","On track") | Compare actual spending against the budget |
📊 Visualising Data with Charts
Using Excel is more than just figures and formulas, but you can also visualise and summarise your financial data with charts! 2
Here's how to create a chart in Excel:
Step 1
Highlight your budget data (excluding totals)
Step 2
Select the Insert tab
Step 3
Choose the chart type that best represents your data
Step 4
Add a chart title and customise colours or labels
Here are some examples of charts that you can use for budget tracking:

➡️Best For: Breaking down your spending and seeing how your money is distributed, showing which category consumes the largest share of your budget
➡️Best For: Comparing your budget to your actual spending, easy to see if you've exceeded your budget
➡️Best For: Tracking expenses over time (especially every month), evaluating whether spending is going up, down or consistent
➡️Best For: Comparing spending by categories (housing, utilities, entertainment, etc)
💡 Tips for Effective Budget Management
If you are using Microsoft Excel for budgeting as a beginner, here are some tips to kickstart your journey.
📈 Regularly Updating Your Budget
First and foremost, you need to record your income and expenses as soon as possible after every transaction to reflect your current financial status.
For example, if you buy groceries for $95 or pay a utility bill of $130, enter these transactions into your spreadsheet immediately. As your data grows, Excel automatically recalculates totals, averages, and category-specific spending using the formulas you've already applied.
Keep your receipts and bank statements in a physical or digital file to double-check if you have missed out on smaller purchases that can accumulate over time.
Also, set aside time to back up your spreadsheet through cloud storage or saving the latest copy on a USB drive to prevent data loss.
Beware of small expenses; a small leak will sink a great ship.
Benjamin Franklin
🏷️ Reviewing and Adjusting Categories
It's important to review your budget monthly or quarterly to track your spending habits and trends. Don't underestimate how drastic your spending could be, in relation to your financial priorities or change in lifestyle.
For instance, getting married or having a child can change your spending habits. Over the course of a few months, you might spend more on groceries and transportation, but spend less on entertainment. You'll have to adjust your budget allocations for these categories.
That being said, it's advisable to adjust your spending categories and budget allocation according to your current financial goals. You'll have to decide if certain recurring expenses are worth spending on or decide if they are no longer relevant when you have a bigger financial commitment (for example, from renting to buying a house).
⚠️ Utilising Conditional Formatting for Alerts
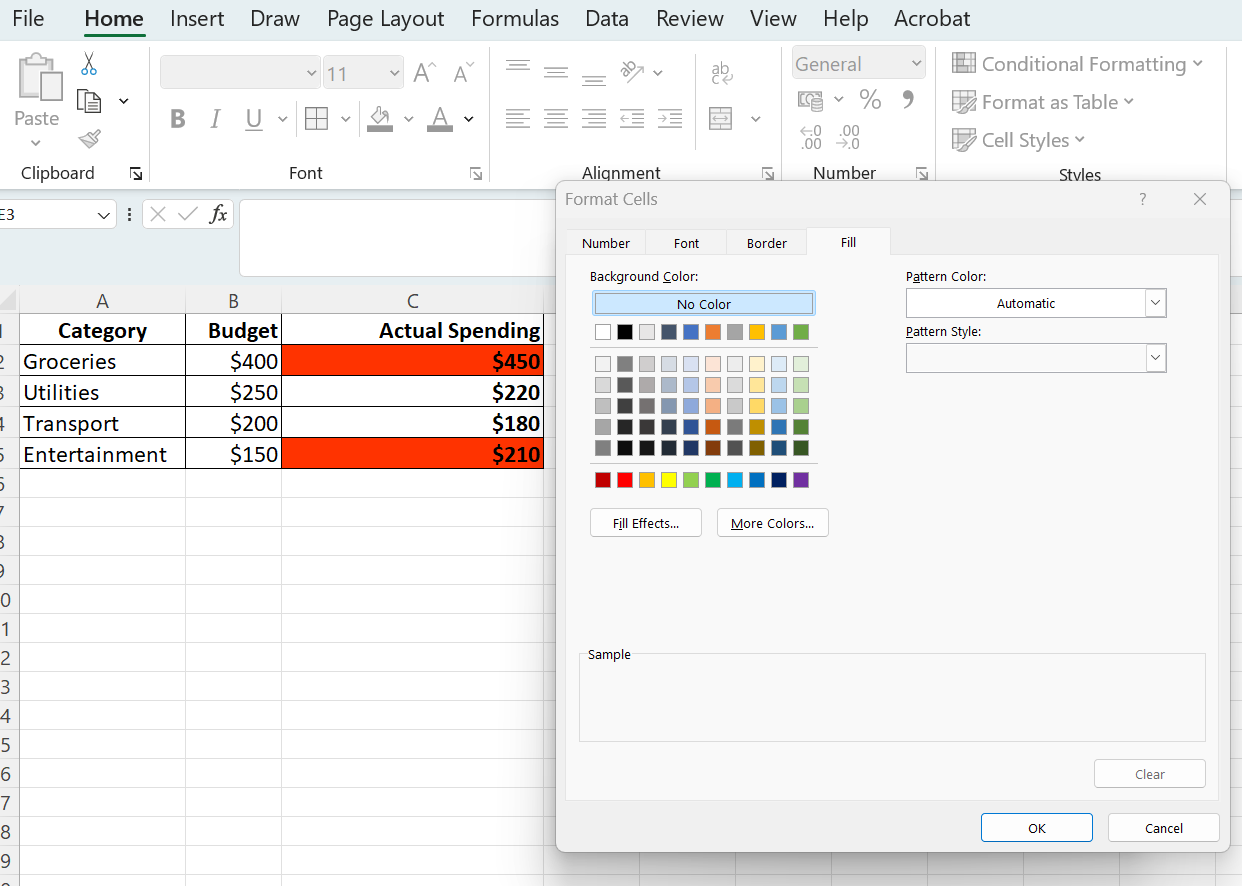
If you love colours and highlights, you should use conditional formatting for your finance data in the spreadsheet. Excel automatically applies colours or formatting when specific conditions are met. 3
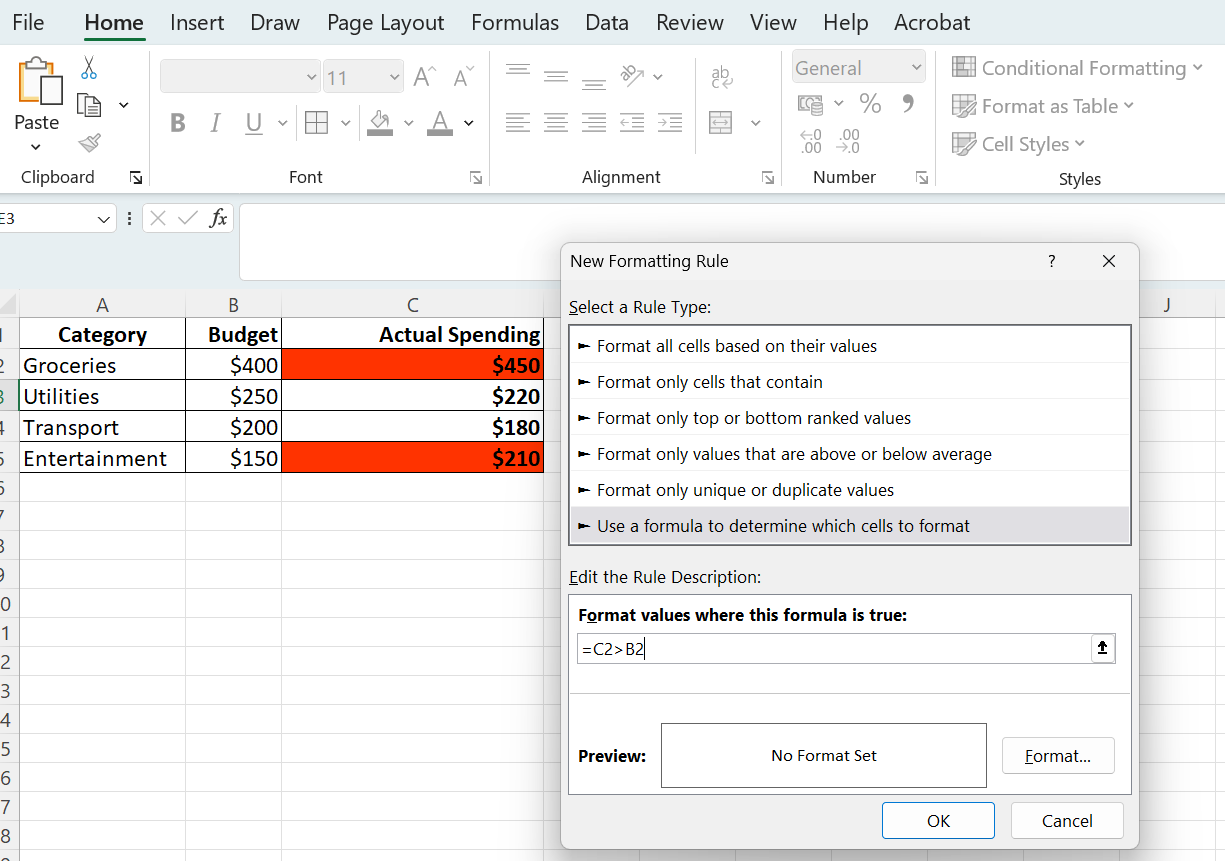
Here's how to apply conditional formatting if you want to find out whenever your actual spending exceeds your budget, using an example below:
- Step 1: Select the Actual Spending cells (for example, C2:C5)
- Step 2: Navigate to Home > Conditional Formatting > New Rule
- Step 3: Select Use a formula to determine which cells to format
- Step 4: Enter the following formula: =C2>B2 (in which the value in column C exceeds column B, indicating overspending)
- Step 5: Click Format, choose a red fill colour or bold font, and then click OK.
We hope you have enjoyed reading this article. Feel free to explore other Excel formulas for beginners.
References
- Use Excel as your calculator | Microsoft Support. (2024). In Microsoft.com. https://support.microsoft.com/en-US/Excel/get-started/use-excel-as-your-calculator
- KeerthikaMsft. (2024). Create a chart from start to finish | Microsoft Support. In Microsoft.com. https://support.microsoft.com/en-us/excel/get-started/create-a-chart-from-start-to-finish
- KeerthikaMsft. (2024). Use conditional formatting to highlight information in Excel | Microsoft Support. In Microsoft.com. https://support.microsoft.com/en-us/excel/use-conditional-formatting-to-highlight-information-in-excel
Summarise with AI:
Did you like this article? Leave a rating!

 Loading...