
As a student preparing to sit the GCSE geography paper, there isn’t a whole lot of certainty when it comes to what might be featured on your exam paper. However, there are some components of the paper that are guaranteed to feature year in and year out.
Being comfortable with your ability to read and extract information from a geology map is one skill that you can bank on, earning you some crucial marks in the exam hall. No matter what question features, you can sit down for your geography paper knowing that you have a portion of your paper already in the bag; quite an attractive incentive, right?
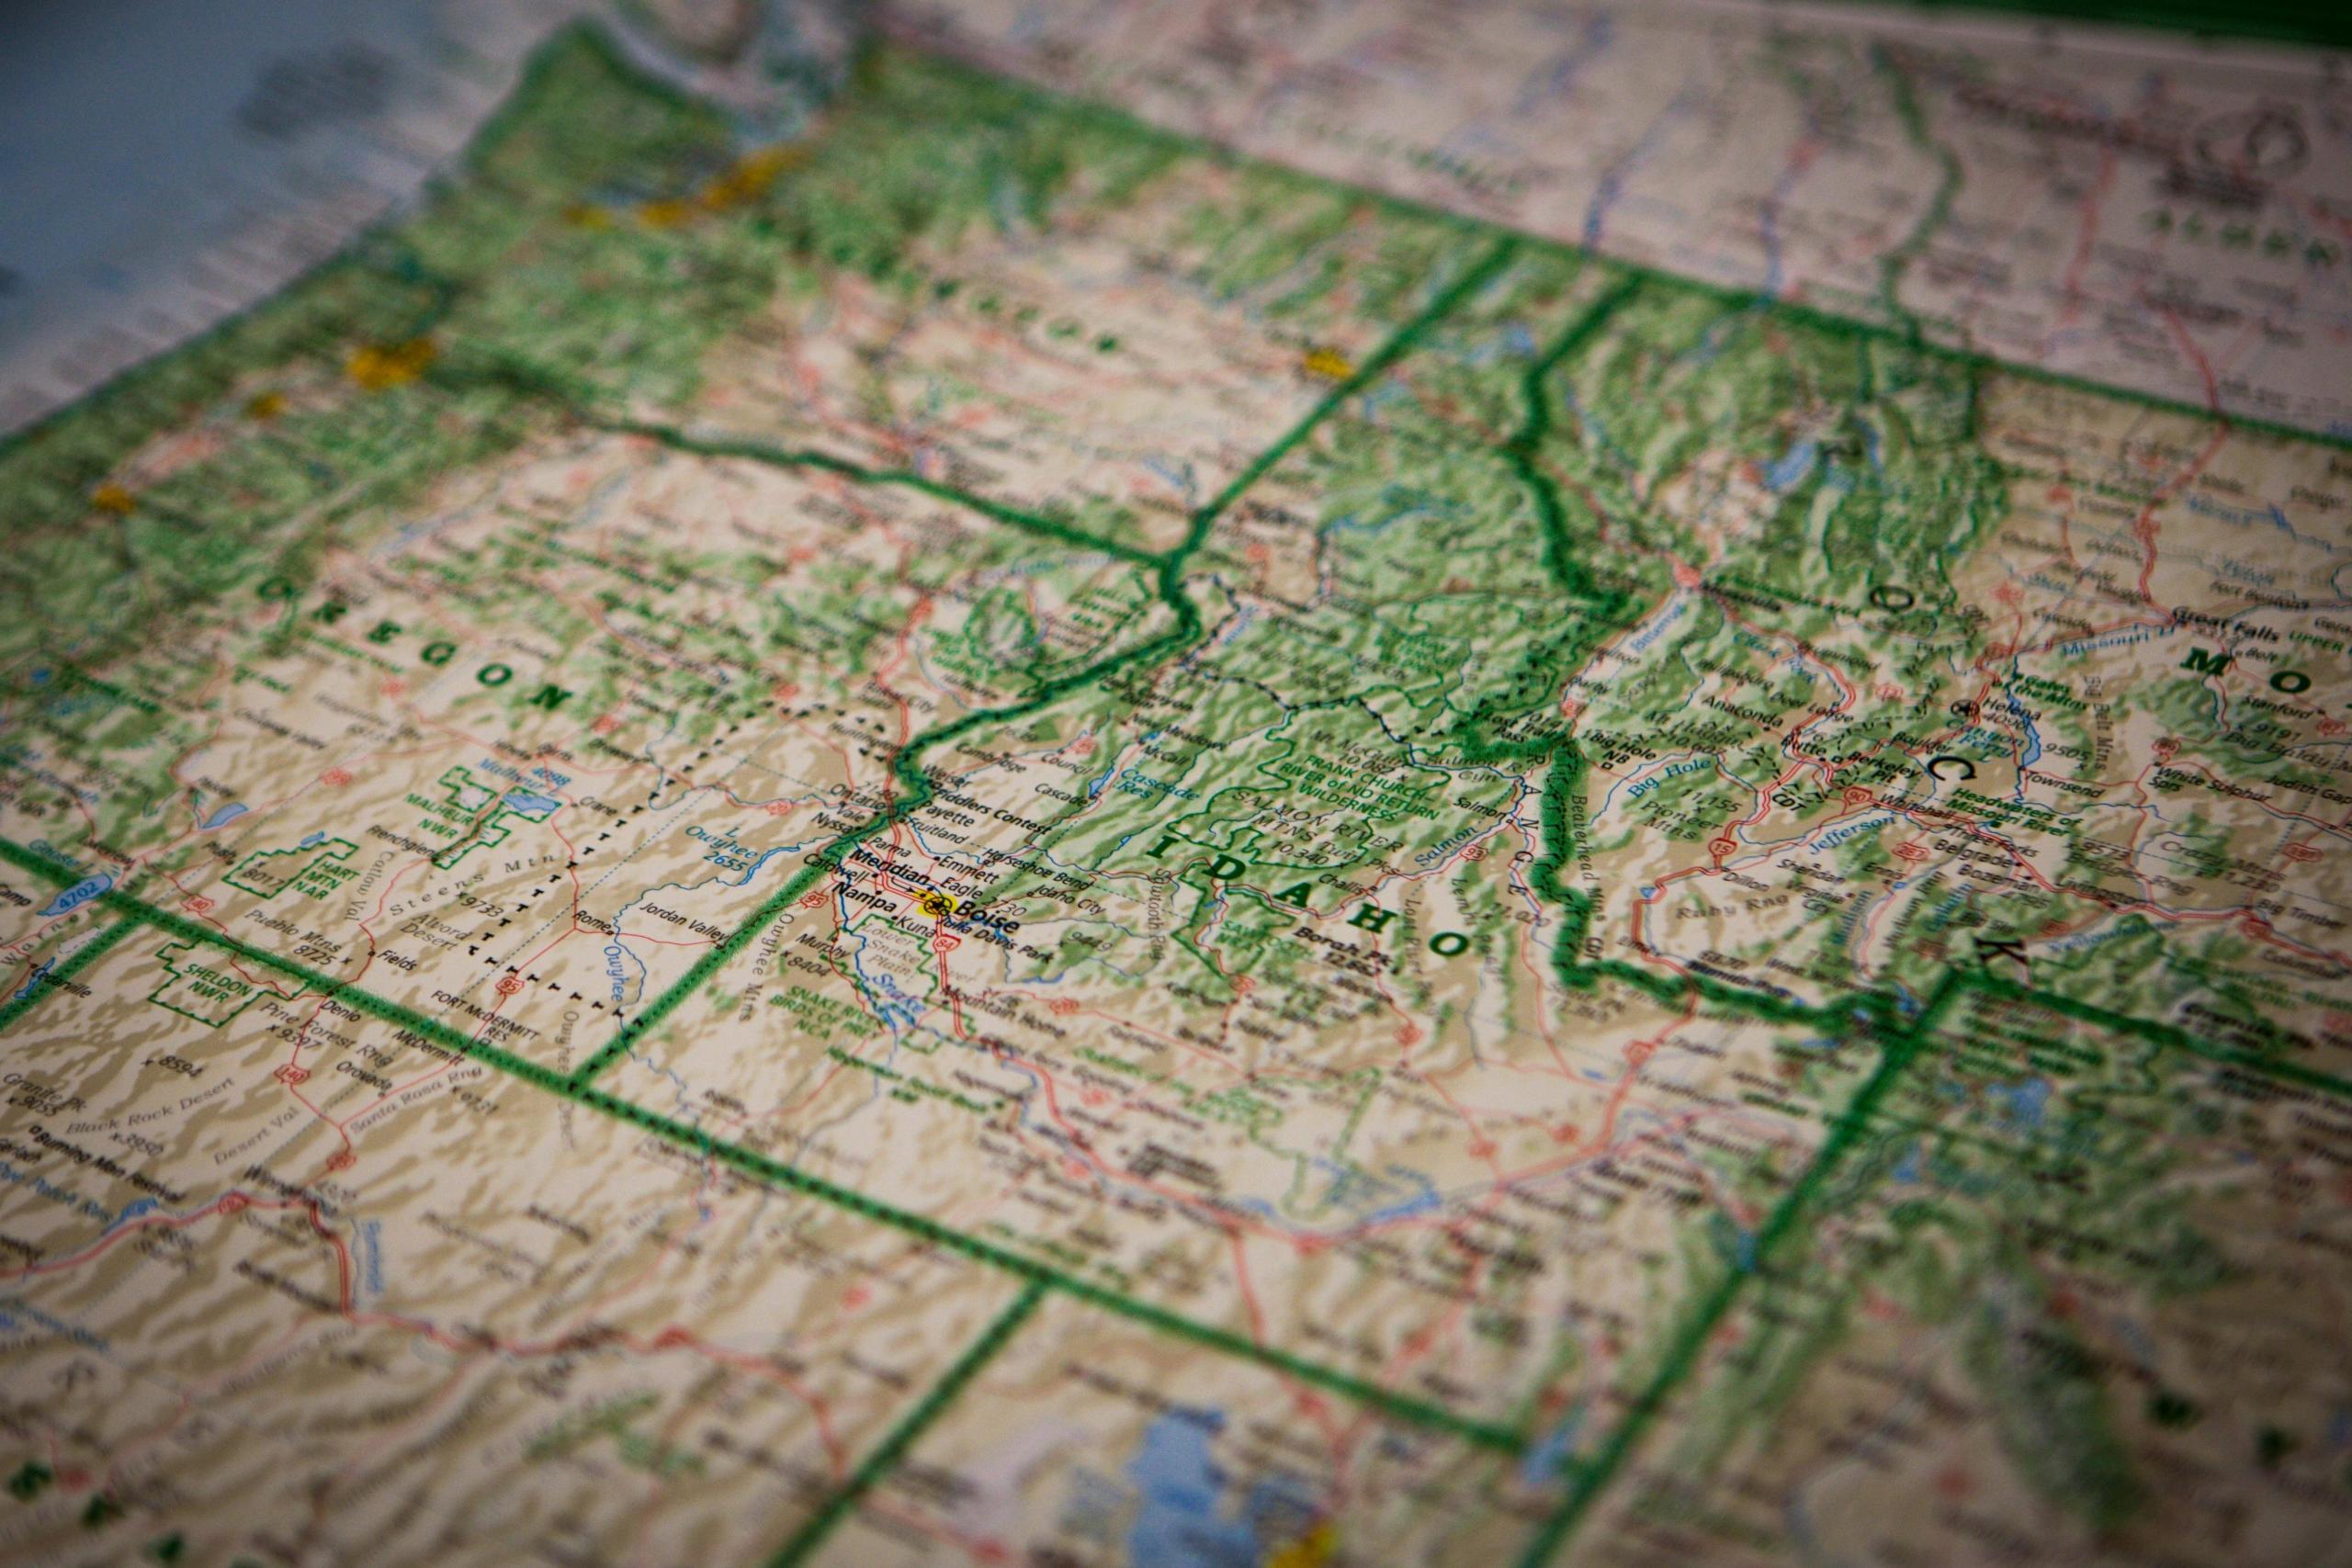
In this article, we’ll have a look at topographic maps and how they relate to geology. We will also provide instructions on how you can decode symbols and make sense of patterns and markings to succeed in your GCSE geography exam!


The Basics of Topographic Maps
〰️ Contour Lines
🛗 Elevation Representation
🏔️ Landscape Features
In order to get to a point where you can walk into the exam hall with confidence, knowing that you have some easy marks to pick up, you’ll need to first know what Topographic maps are. Don’t be surprised if this features as a short question on your paper!

Topographic maps are essential tools that help us understand the Earth's surface by providing a 2D representation of a 3D landscape. They allow us to visualise the shape and features of the terrain and are particularly useful when it comes to hiking, construction and your GCSE geography coursework, of course!
Mastering essential geographic and cartographic skills will be crucial when it comes to excelling in your GCSE Geography exam.
Contour Lines
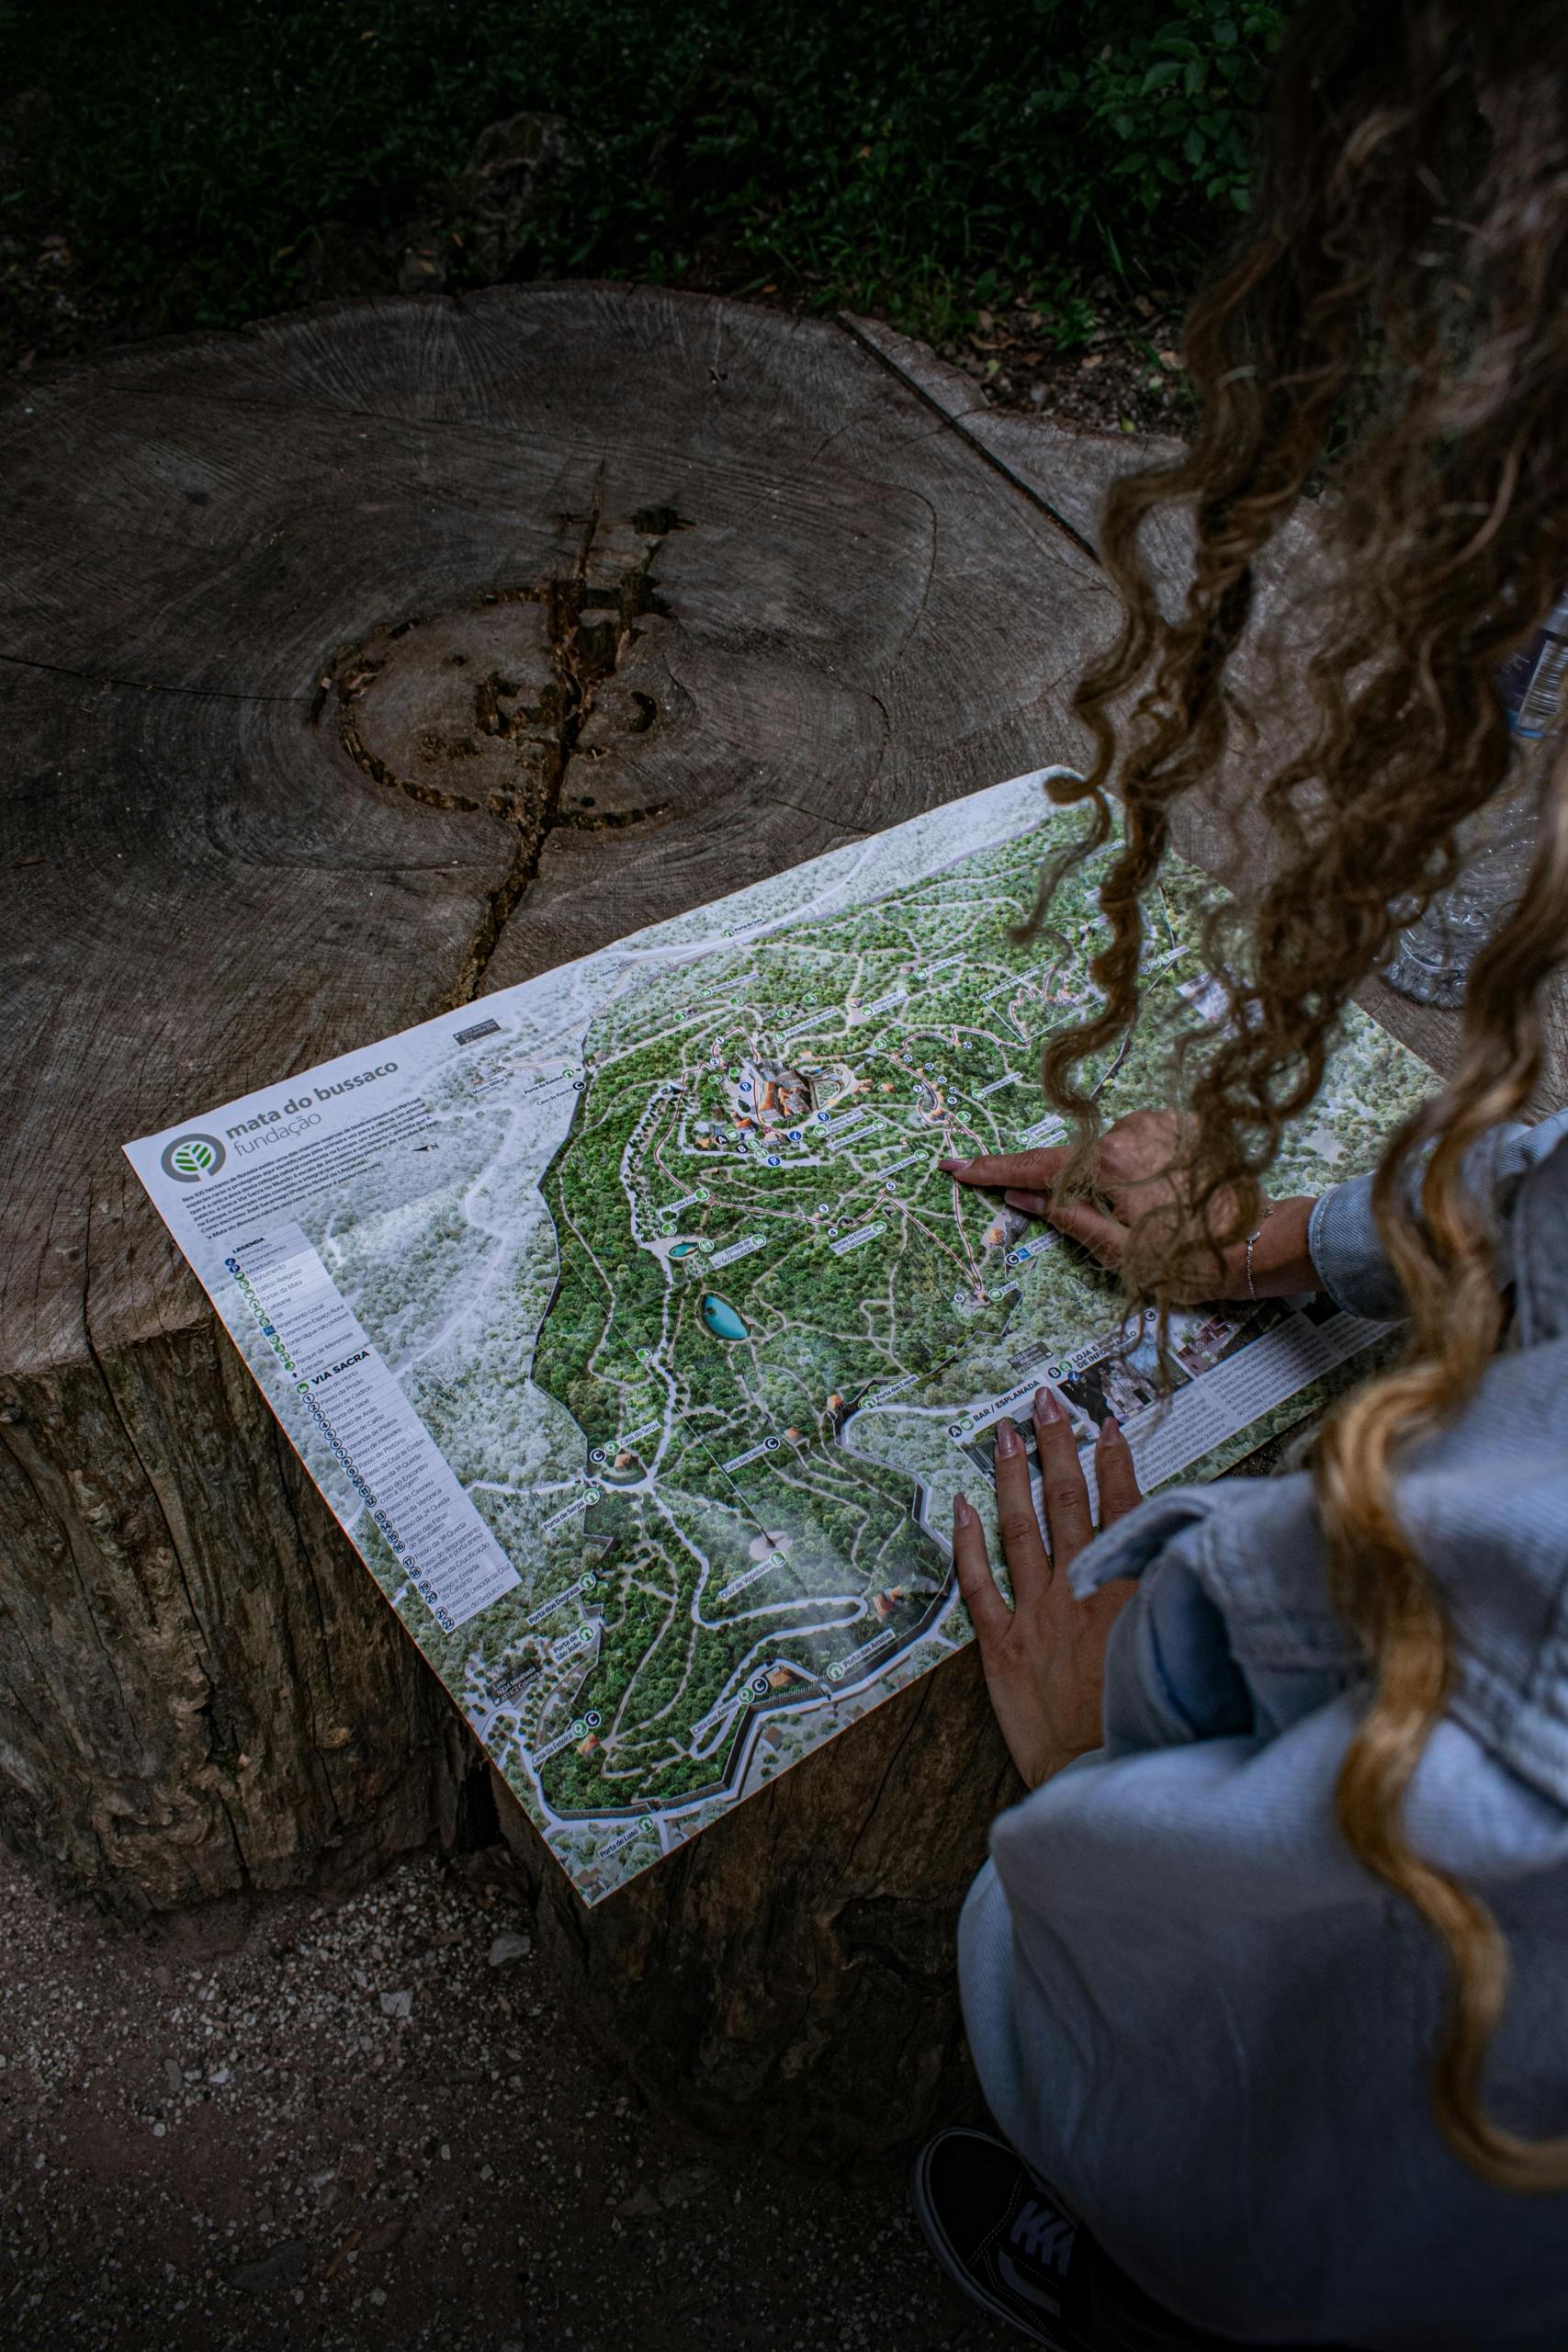
So, what should you be on the lookout for when it comes to interpreting a geology map?
Well, when you first look at one of these maps, one of the first things that will capture your attention is the funny-looking lines that you’ll find looping around areas of land. These are known as contour lines, and you’ll notice that they connect areas of the same altitude or height.
Since our topographic maps are displayed on a 2D surface, contour lines really help describe the land on our maps.
On top of telling us the height of the terrain above sea level, the distance between the lines also gives us an idea of the slope gradient. If the lines are tightly packed together, then this tells us that there is a steep incline and vice versa!
Elevation Representation
Another descriptive feature that you will likely need to know in order to answer the bulk of the questions that might come your way in this section of the GCSE exam paper. You’ll need to be able to determine the election according to the respective legend of the map.
Here, you’ll be able to read the amount of space between nearby contour lines according to the map’s scale and the ruggedness of the land.
The elevations of the terrain will also be quite simply marked on every fifth contour line.
In order to calculate the altitude of any point in between, you would just need to count the number of contour lines separating the pint from the nearest elevation representation.
With this little technique in your arsenal, you’ll be able to answer any short question that might come your way on map reading. Understanding key components of OS maps is essential for GCSE Geography success.
Landscape Features
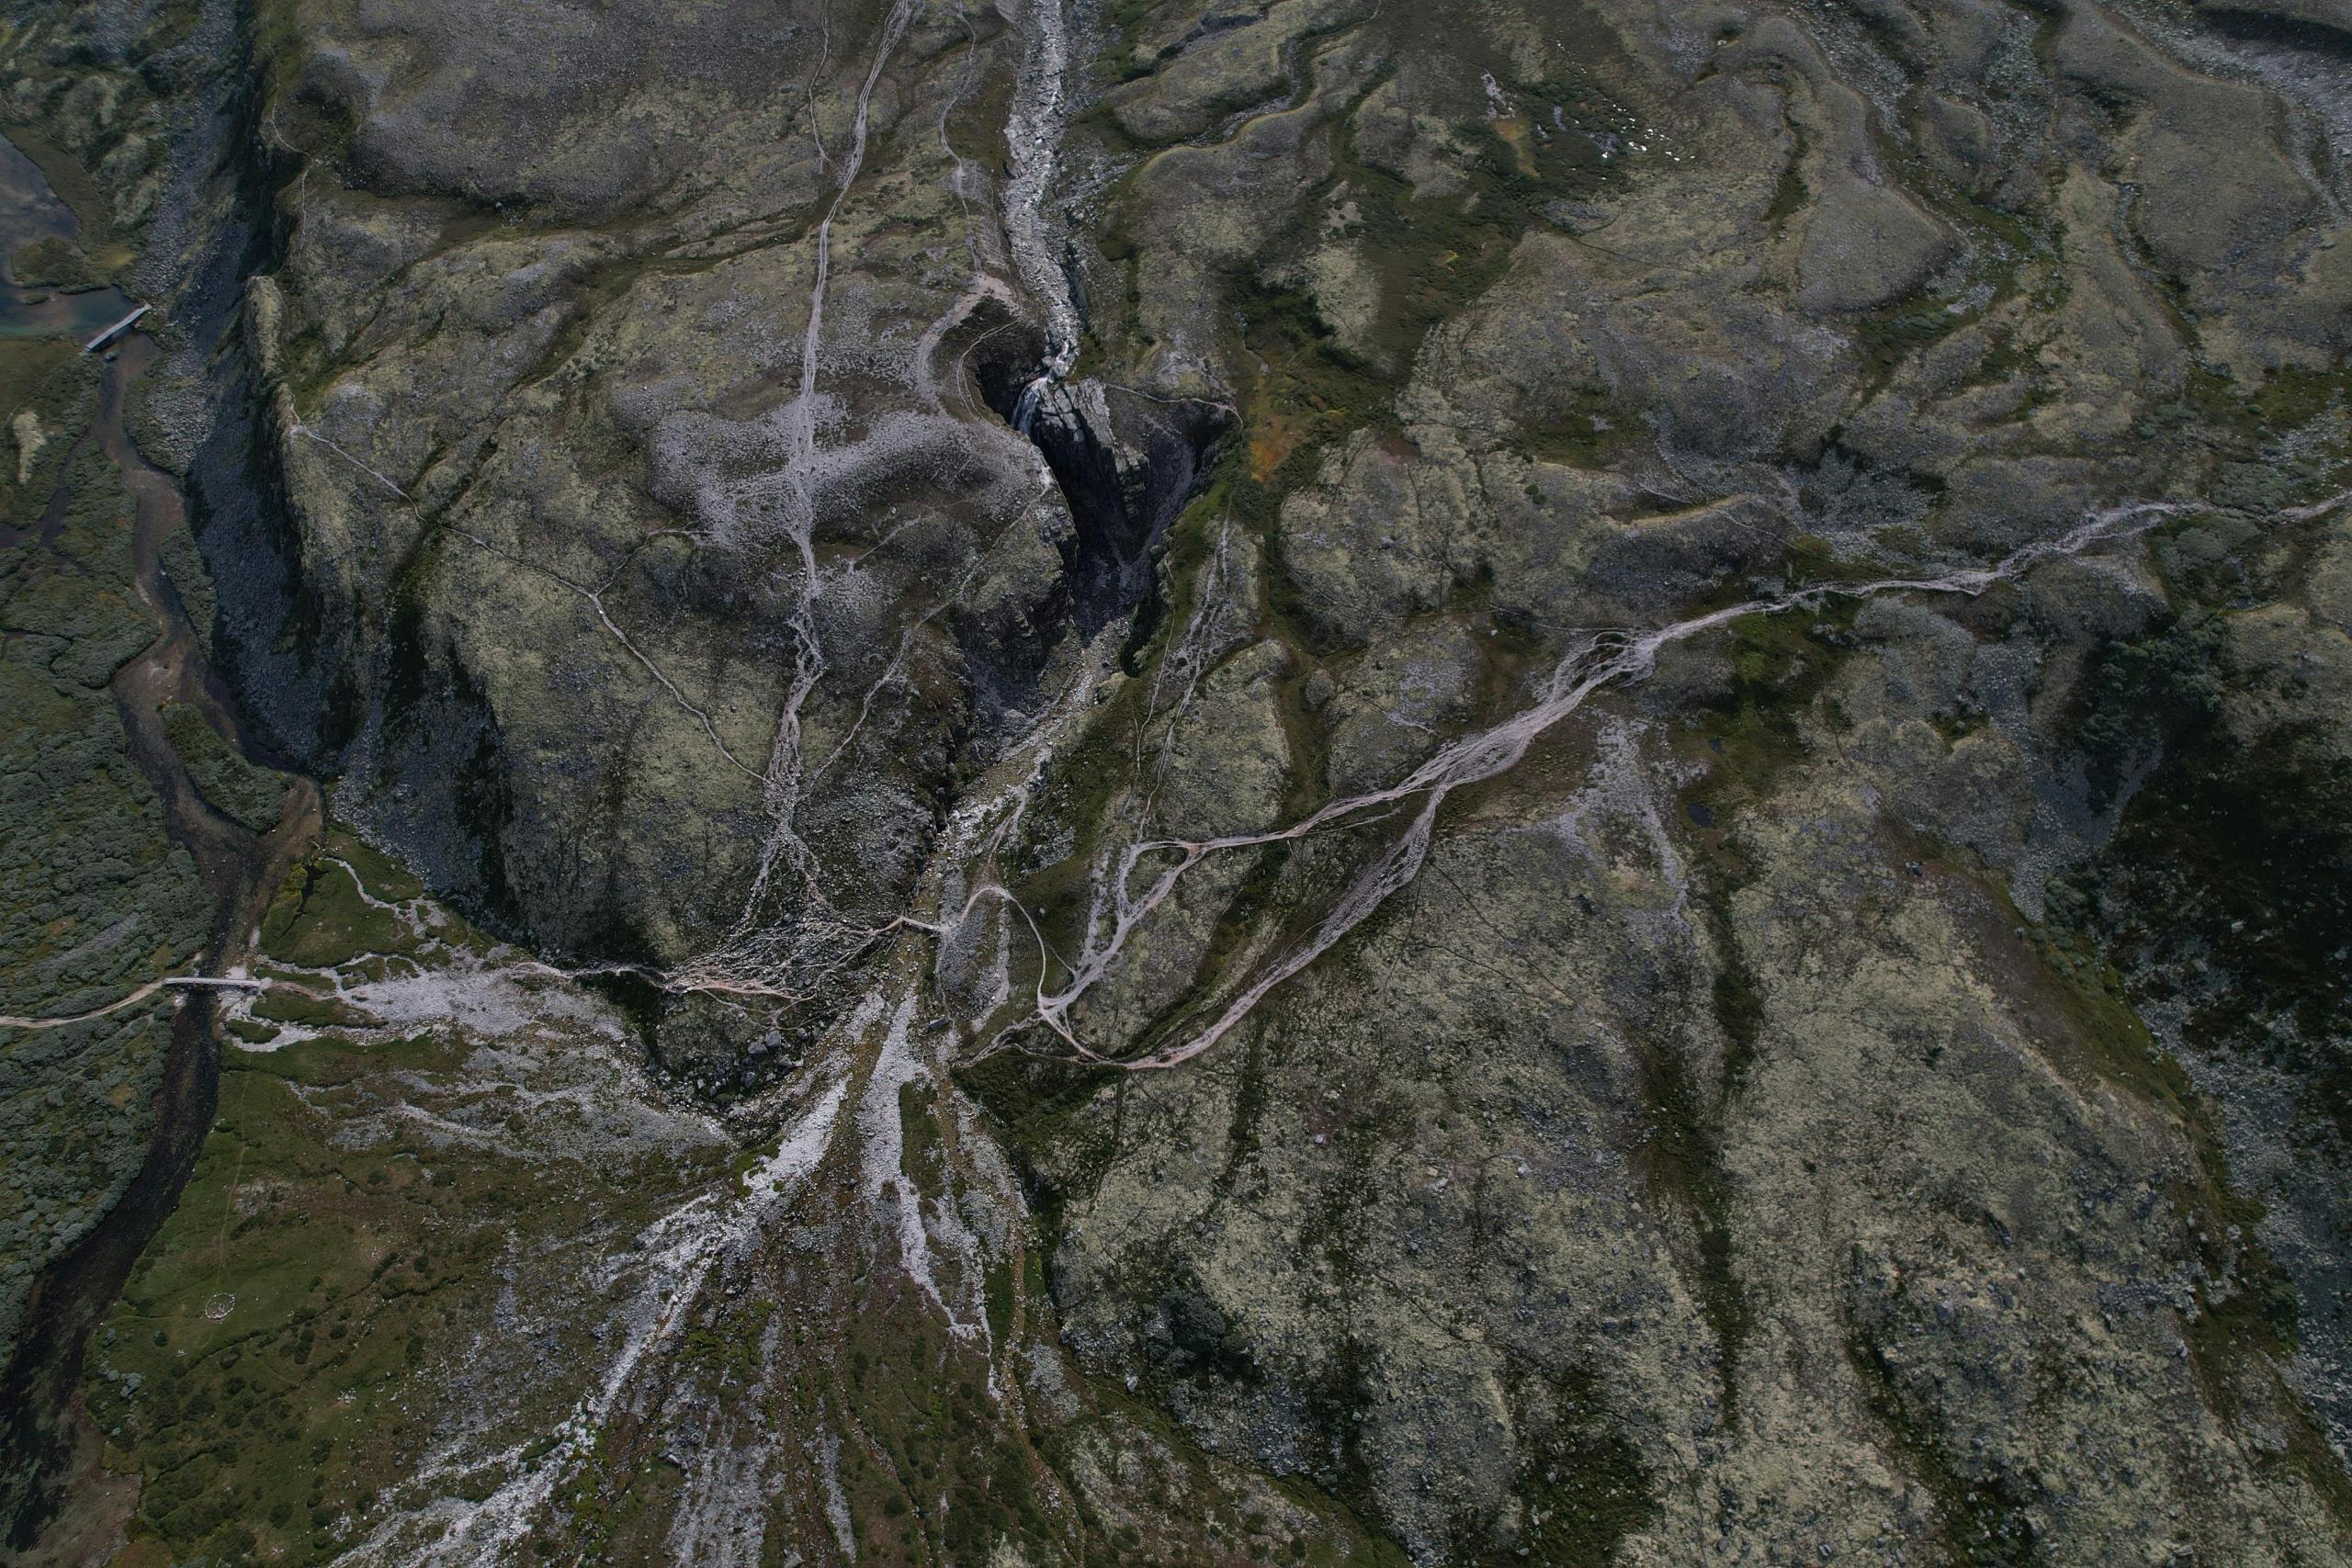
Next up, you’ll need to have a familiarity with the range of additional features that will help you navigate the Topographic maps short rations likely to feature on your paper. These features include concentric circles that represent hills or mountain tops and V-shaped lines that are used to show valleys or gullies when pointing uphill and ridges or spurs when pointing downhill.
This isn’t something that requires a whole lot of storage space in your memory, but by allocating some time to practising your map reading skills, you will be rewarded with some easy marks!
Decoding Geological Map Symbols
Once you train your eye to notice the various descriptive symbols that are scattered around a geological map, you’ll find yourself with an enhanced understanding of the respective terrain while positioning yourself nicely for top grade in your geography exam!
The symbols that can be found on your map are full of details that describe rock type and structural elements, as well as age markers to give you a glimpse into the terrain’s composition.
Rock Types
If you haven’t already covered maps alongside your geography class at school, you might want to take note of how rock types can be conveyed visually. With a little practice, you’ll be able to identify the various rock types by the colours and designs that are used on the map at the respective area of terrain you are analysing.
This isn’t as hard to do as you might think, as each colour actually corresponds with a specific rock type.
For instance, if you come across any areas of light blue on your map, you’ll immediately be able to distinguish that the rock dates back to the Pennsylvanian age.
On top of colour being a valuable indicator for rock types, you’ll also need to pick up on patterns such as dots or lines that will be able to go a step further in distinguishing between the various rock types.

So, imagine you turn over your GCSE exam booklet and see a map with a pattern of dots or parallel lines. These indicators would symbolise the presence of conglomerate formations or shale, respectively.
Structural Features
Another key determining feature that you’ll be able to rely on when navigating any questions on a map is the strike and dip symbols that will show the orientation of rock layers.
The longer line is what represents the strike, which is the compass direction of a horizontal line on a tilted plane. Then, all you’ll be left with is to remember that the shorter line, perpendicular to the strike, indicates the direction of the dip or the downhill slope of the rock layer. Lastly, if you notice that the symbol is accompanied by a number, this is actually indicating the angle of the dip!
There are some other features that you may also come across at GCSE level, such as fault lines, which will be conveyed with thick black lines, and fold axes, which will be evident from the lines you see with arrows indicating the direction of folding.
If you’re looking to understand more about an area while stacking the odds in your favour when it comes to your exam, then knowing these symbols will go a long way!
Colour Schemes in Geological Maps
While your Geological map might look quite decorative and easy on the eye, the colours aren’t just to liven up the drawing.
The British Geological Survey (BGS) uses a unique colour coding system called BGSREF, which assigns colours to geological formations using a three-digit code representing Yellow, Cyan, and Magenta (YCM) values.
This system enables colour definition by converting YCM values into percentages that will help you when it comes to distinguising between different geological formations.
One useful thought to consider when navigating this portion of your GCSE geography course is to consider the map’s goal and readability.
When creating maps, map makers typically opt for colours that have a contrast of 20 per cent to ensure the distinction between various sections of the map. Knowing these colour patterns can really help you when it comes to looking at and understanding maps, an incredibly valuable skill for GCSE geography students looking to gain an edge in their exams!
By understanding the meaning behind colours on the map's legend, you’ll be able to leave chance out of the equation and maximise your chances of achieving the grade you deserve on the day! Perfecting your ability to create effective geographic maps will give you an edge in the GCSE Geography assessment.
Application of Your Knowledge
After reading, you should find yourself with a sense of confidence in your ability to read geological maps. By knowing how to read these maps as well as identify key symbols and what they tell you about the respective terrain, you’ll be able to pick up all of the marks that are up for grabs each year in the GCSE exams.
Outside the scope of achieving your potential in your upcoming exams, your refined knowledge of how to read and analyse geological maps will also serve to add to your understanding of the types of rocks, surface ages, and structural elements shaping our environments.
Equipped with this skill set and understanding, you will also deepen your insights into Earth’s evolution and past events, laying the groundwork for entering the field of earth sciences.
Summarise with AI:
Did you like this article? Leave a rating!