Equilibrium price is one of the most important concepts in economics, representing the point at which the quantity of goods supplied equals the quantity of goods demanded.
This balance ensures that there is no surplus or shortage in the market and strikes a balance (equilibrium) between the market and desire for a product, and the amount of a product manufactured.
Understanding how the equilibrium price is determined, and the factors that influence it, is crucial for grasping how markets operate. This post delves into the interaction between supply and demand, the consequences of excess demand and supply, and how these concepts can be applied to real-world markets using supply and demand diagrams.


Interaction Between Supply and Demand
The terms supply and demand are used a lot in the world of business. We’ve all seen super simple examples on a small level. When a concert has more demand than supply in terms of tickets, resellers make a fortune by upping the prices.
The interaction between supply and demand determines the equilibrium price in a market. This can be illustrated using a supply and demand diagram.
In the diagram above, the demand curve (D) slopes downward, indicating that as the price decreases, the quantity demanded increases. Conversely, the supply curve (S) slopes upward, showing that as the price increases, the quantity supplied also increases. The point where these two curves intersect is the equilibrium price (P*) and equilibrium quantity (Q*).
Excess Demand and Excess Supply
When the market is not at equilibrium, excess demand or excess supply occurs, leading to changes in prices. Again, this is a concept we can often see in daily life. Think of a toy sold in stores that is all the rage for the Christmas rush, but suddenly is no longer popular. Prices will keep coming down while demand is low.
Excess Demand (Shortage)
When the price is below the equilibrium price (P*), the quantity demanded (Qd) exceeds the quantity supplied (Qs), creating a shortage.
Consumers are willing to buy more at a lower price, but producers are not willing to supply enough. This shortage exerts upward pressure on prices as consumers compete to purchase the limited supply, pushing the price towards the equilibrium.
Excess Supply (Surplus)
When the price is above the equilibrium price, the quantity supplied exceeds the quantity demanded. The makers of products and sellers of services are willing to supply more at a higher price, but consumers are not willing to buy as much.
This surplus exerts downward pressure on prices as producers lower prices to clear excess stock, pushing the price towards the equilibrium.
Impact of Changes in Equilibrium Prices
Supply and demand diagrams are powerful tools for understanding the impact of changes in the market. This is relevant to a number of different areas, such as commodities markets, which can vary based on things like newly proven oil reserves.
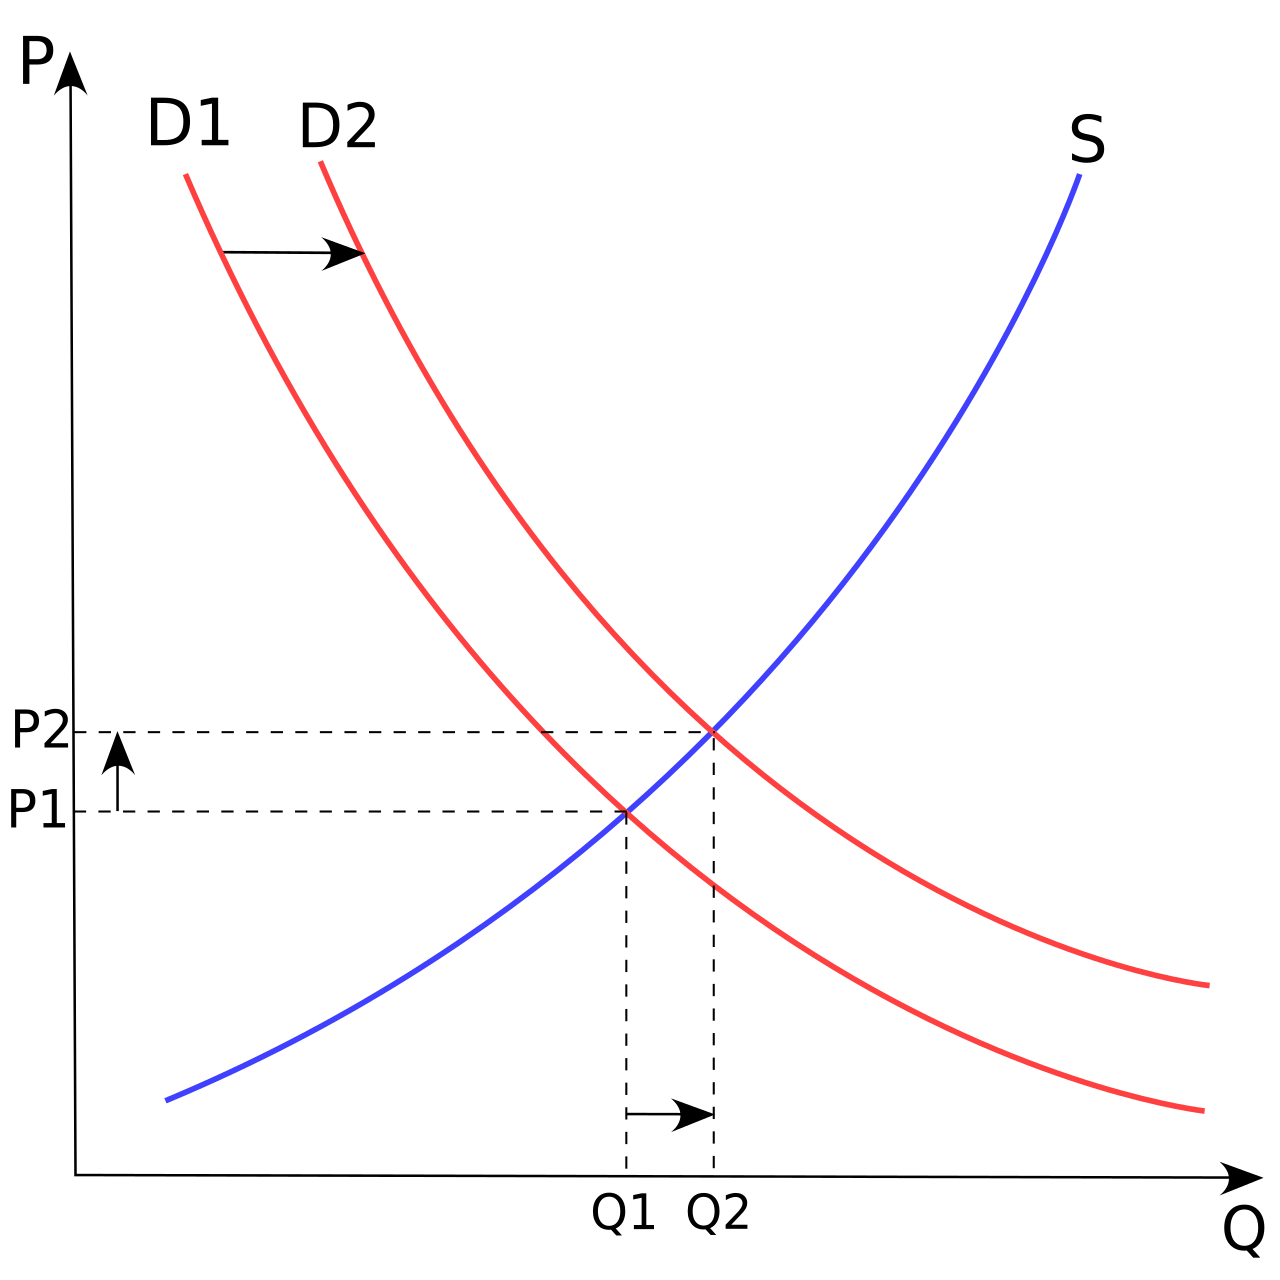
Increase in Demand
Factors such as increased consumer income or a rise in the popularity of a product can shift the demand curve to the right (D1).
This shift results in a higher equilibrium price (P1) and a higher equilibrium quantity (Q1).
Decrease in Supply
Factors such as increased production costs or supply chain disruptions can shift the supply curve to the left (S1).
This shift results in a higher equilibrium price and a lower equilibrium quantity.
These shifts can be represented on supply and demand diagrams, helping to visualise the new equilibrium points and understand the market dynamics.
Application to Real-World Markets
Supply and demand curves can be applied to loads of real-world markets to analyse price and quantity dynamics. The concept is pretty much ingrained in our daily lives!
Housing Market
An increase in population or a rise in income can increase the demand for housing, shifting the demand curve to the right and raising prices.
On the other hand, an increase in construction costs or zoning restrictions can decrease the supply, shifting the supply curve to the left and also raising prices.
Technology Market
Technological advancements can increase the supply of products like smartphones, shifting the supply curve to the right and lowering prices.
If a new model is highly anticipated, the demand for the older model may decrease, shifting the demand curve to the left and lowering prices further. This is why the iPhone or other tech devices decrease in price as the model ages.
Agricultural Market
Weather conditions can significantly impact the supply of crops. Good weather increases supply, shifting the supply curve to the right and lowering prices.
A health trend promoting certain foods can increase demand, shifting the demand curve to the right and increasing prices.
These applications show how the fundamental principles of supply and demand can be used to analyse various markets and predict changes in prices and quantities.
Demonstrating Revenue on a Supply and Demand Diagram
Revenue, a crucial concept for businesses, can also be demonstrated on a supply and demand diagram. Total revenue is calculated as the price (P) multiplied by the quantity sold (Q).
Consider a point on the demand curve where the equilibrium price (P*) and equilibrium quantity (Q*) are determined. The total revenue (TR) at this point is represented by the area of the rectangle formed by P* and Q*:
𝑇𝑅 = 𝑃∗ × 𝑄∗
This area shows the total income generated by sales at the equilibrium price. Changes in demand or supply that affect the equilibrium price and quantity will consequently alter the total revenue.
So, if demand increases and the equilibrium price and quantity rise, total revenue increases. If supply decreases and the equilibrium price rises while the quantity falls, the change in total revenue depends on the levels of the price and quantity changes.
Conclusion
The equilibrium price is a central concept in the world of economics, reflecting the balance between supply and demand in a market. The concept can be seen a lot when we’re buying products and services in daily life.
By using supply and demand diagrams, we can visualise how the market reaches equilibrium and understand the effects of excess demand and supply. These diagrams are also useful for analysing real-world market scenarios and predicting the impact of changes in supply and demand.
Test Your Knowledge
Select the correct response from the options below.
What is the definition of equilibrium price?
Please select a response.
The equilibrium price is the point at which the quantity of goods supplied equals the quantity of goods demanded, ensuring there is no surplus or shortage in the market.
Select the correct response from the options below.
In a supply and demand diagram, what does the downward slope of the demand curve indicate?
Please select a response.
The downward slope of the demand curve indicates that as the price of a good increases, the quantity demanded decreases.
Select the correct response from the options below.
What happens when there is excess demand (shortage) in the market?
Please select a response.
When there is excess demand, the quantity demanded exceeds the quantity supplied, leading to a shortage. This exerts upward pressure on prices as consumers compete to purchase the limited supply.
Select the correct response from the options below.
Which of the following can cause a shift in the demand curve to the right?
Please select a response.
An increase in consumer income can increase the demand for goods and services, shifting the demand curve to the right, indicating a higher quantity demanded at each price level.
Summarise with AI:
Did you like this article? Rate it!