A quadratic inequality looks like a standard quadratic expression but uses inequality signs (>, <, ≥, or ≤) instead of an equals sign.
To solve these, we must understand the shape of the graph. A "positive" quadratic (ax² where a is positive) creates a U-shaped curve called a parabola. The points where the curve crosses the x-axis are our critical values.
- If the inequality is > 0 or ≥ 0, we are looking for the regions where the curve is above the x-axis.
- If the inequality is < 0 or ≤ 0, we are looking for the region where the curve is below the x-axis.


How to Solve Quadratic Inequalities
Following a consistent method ensures you do not get your inequality signs mixed up.
- Rearrange: Make sure the inequality is in the form ax² + bx + c > 0 (or the relevant sign).
- Find Critical Values: Treat the inequality as an equation (= 0) and solve it by factorising, using the quadratic formula, or completing the square.
- Sketch the Graph: Draw a quick sketch of the parabola. Mark your critical values on the x-axis.
- Identify the Region: Look at the inequality sign to decide if you need the part of the curve above or below the x-axis.
- Write the Solution: Express the regions as inequalities.
- One region (between two values) is written as: a < x < b.
- Two separate regions (the "tails") are written as: x < a or x > b.
Worked Example
Solve the inequality: x² - 5x + 6 ≤ 0
Step 1: Find Critical Values. Set the expression to zero and factorise: x² - 5x + 6 = 0 (x - 2)(x - 3) = 0 The critical values are x = 2 and x = 3.
Step 2: Sketch the Graph. Draw a U-shaped curve crossing the x-axis at 2 and 3.
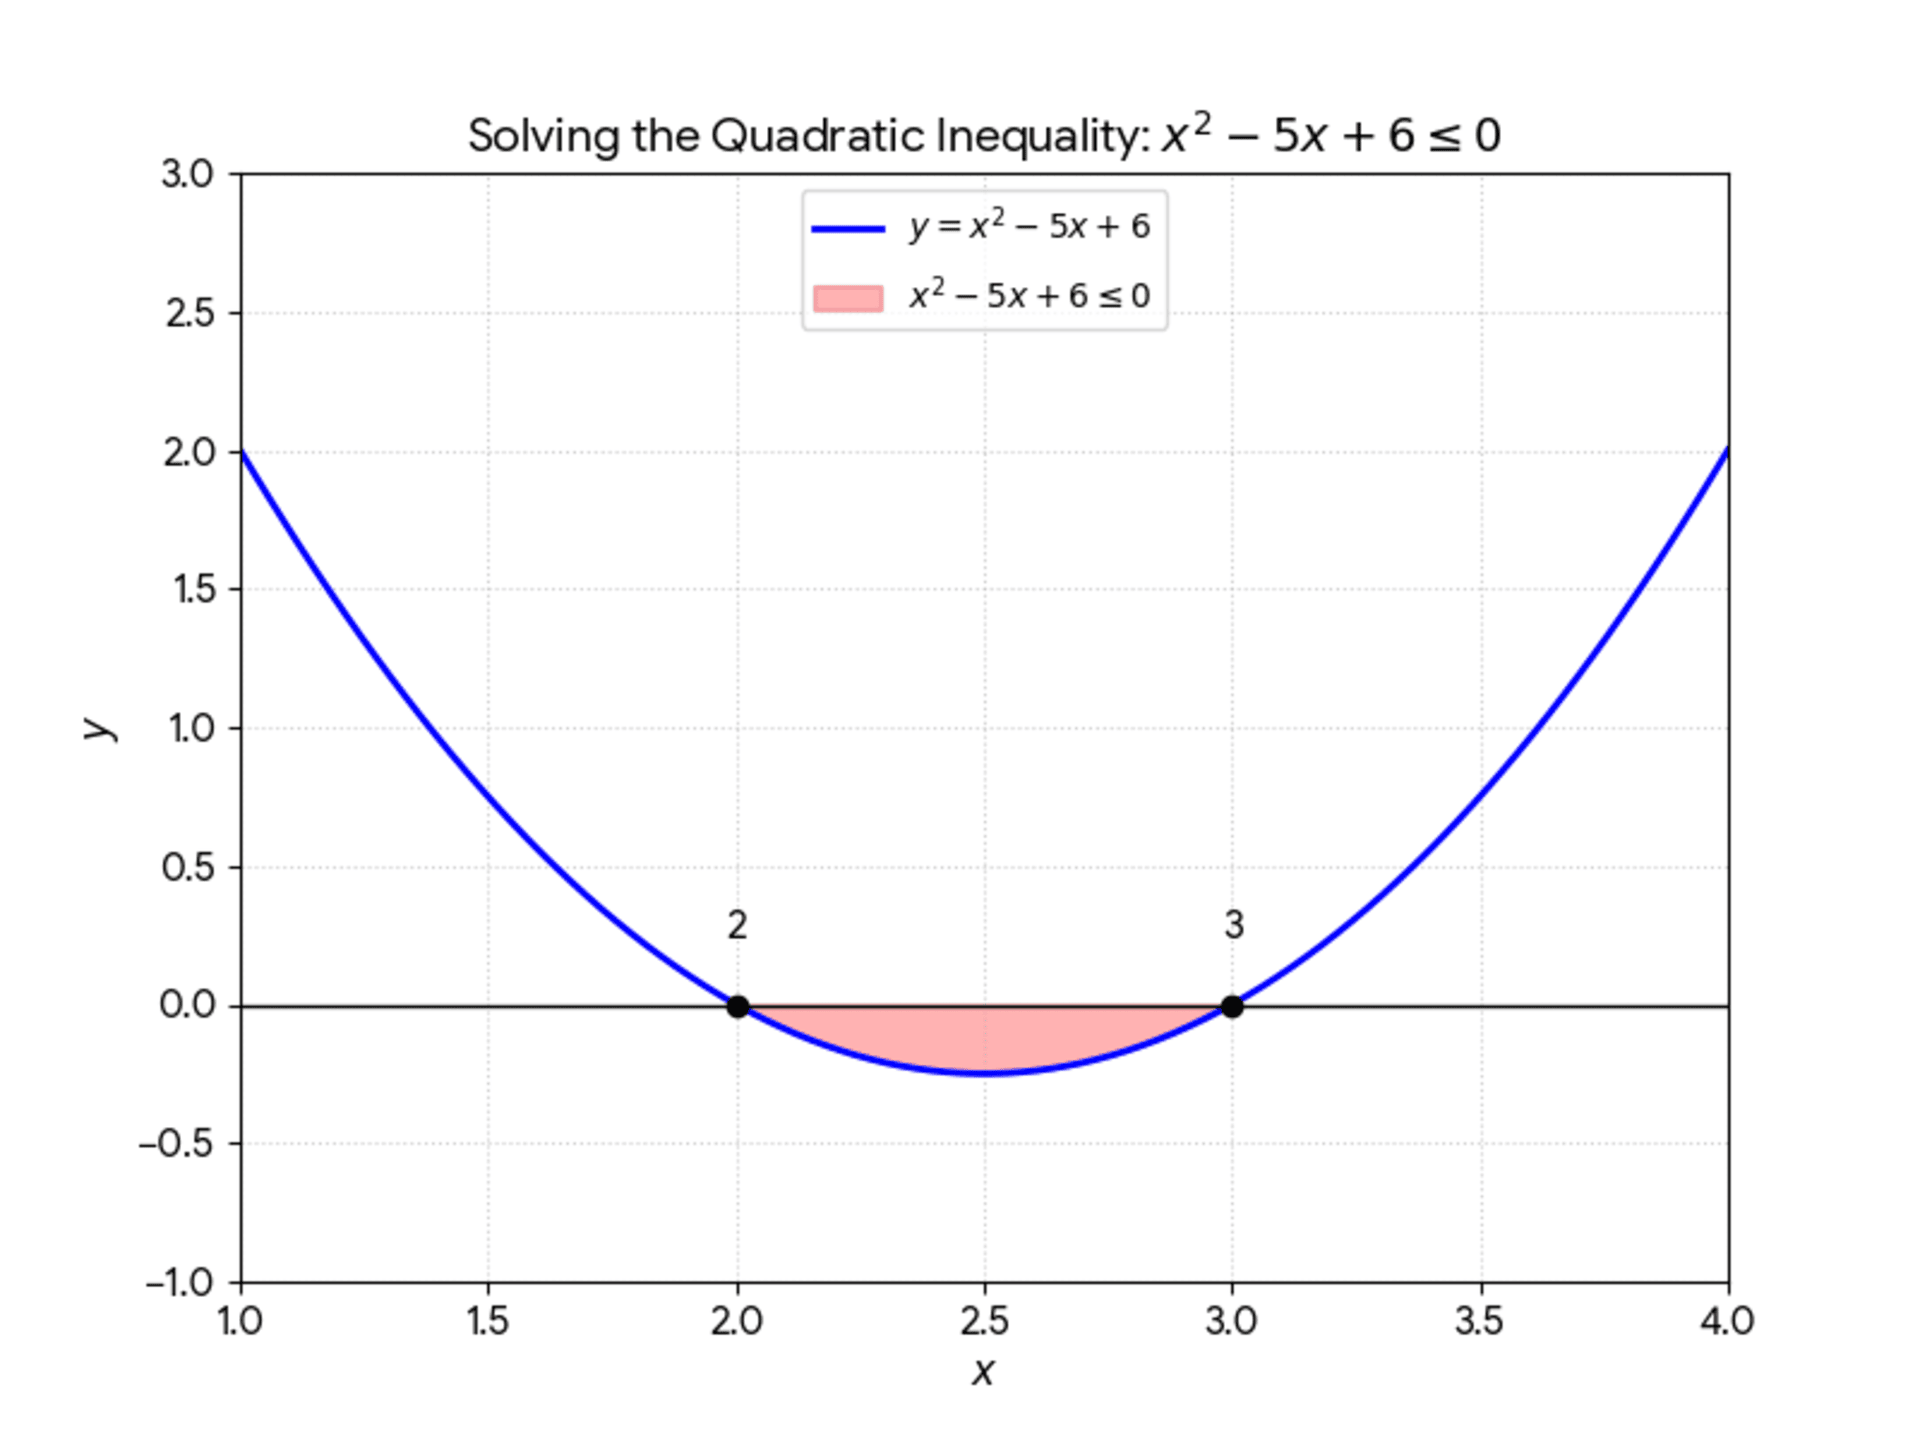
Step 3: Identify the Region. The inequality is ≤ 0, so we want the region below the x-axis. This is the "valley" between our two critical values.
Final Solution: 2 ≤ x ≤ 3
To practice these concepts, check out our handy quadratic inequalities worksheet!
Summarise with AI:
Did you like this article? Rate it!


I think the solutions were incorrect!
Can you point out which solutions?