To learn about logarithmic functions, first, recall exponential functions because logarithmic functions are the inverses of the exponential functions. The general form of the exponential function is

, where a represents the base and

represents the power. The inverse of
is

. The expression
. is equivalent to
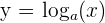
, where

and

. In words, we can describe it as the logarithm of
to the base

is

. Keep in mind that it is not possible to take the logarithm of a negative number or 0. For example, consider the simple exponential function

. In words, we can say that nine raised to the power 2 is 81. Now, we will see how to write this function in logarithmic form and say in words. In the logarithmic form, we can write this expression as

. In words, we can describe it as the logarithm of 81 to the base 9 is 2. In the following table, we have written some common functions in exponential and logarithmic forms.
| Exponential form | Logarithmic form |
|---|---|
 |  |
 |  |
 |  |
 |  |
From the above table, we can conclude that the base of exponential and its corresponding logarithmic function is the same.


Natural and common logarithms
Natural logarithms are logarithmic functions with base e. Natural log is expressed as

Common logarithms are the logarithmic functions with base ten. They are expressed as follows:

Before proceeding to the graphs of logarithmic functions, we will evaluate some logarithmic functions first in the following examples.
Example 1

Solution
We will solve the above expression in multiple steps. Step 1 – Convert in exponential notation Suppose

. First, express this function in exponential notation:

Step 2 – Solve for x The exponent we require on 14 to get 196 as an answer is 2, hence

.
Example 2
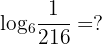
Solution
Step 1 – Convert in exponential notation Suppose
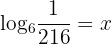
. Convert the above function in exponential form:

Step 2 – Solve for x We know that when an exponent is negative, then final answer is a fraction. In the above example, the exponent must be negative because the answer

is in fractional form. If the exponent of 6 is 3, we get the answer 216. If the exponent is -3, we will get

.
Example 3

Solution
Step 1 – Convert in exponential notation Suppose

. First, convert the function in exponential form like this:

Step 2 – Solve for x Since,

, so

.
Example 4

Solution
Step 1 – Convert in exponential notation Suppose

. Convert this logarithmic function into an exponential form like this:

Step 2 – Solve for x Since,

, so

Characteristics of Logarithmic Functions Graphs
We know how to evaluate the logarithmic functions. Now, we will see how to plot logarithmic functions in a coordinate axis. But before proceeding to some examples, let us see what are some of the characteristics of graphs of the logarithmic functions. The graphs of all logarithmic functions will have the following characteristics:
- The graph of logarithmic functions passes through the points (1,0).
- If the base of a logarithmic function is greater than 1, then the graph increases
- If the base of the logarithmic functions is greater than 0 but smaller than 1, then the graph decreases.
- The domain of the logarithmic function is all numbers greater than 0.
- The range of logarithmic function is all real numbers
- Graph of these functions is asymptotic to the y-axis, i.e. it gets closer to the y-axis but never crosses it.
Example 1
Graph the function

and is logarithmic form

.
Solution
Step 1 We will construct two separate tables for both the functions. The table of values for the exponential function
is given below:
| x | f(x) |
|---|---|
| -2 | 1/9 |
| -1 | 1/3 |
| 0 | 1 |
| 1 | 3 |
| 2 | 9 |
Step 2 Plotting the above values in a coordinate axis will give the following graph of the exponential function: 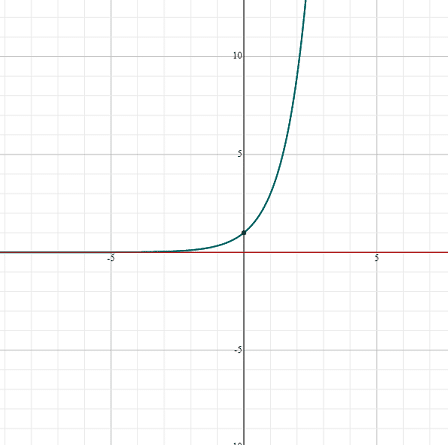

will be written as

in logarithmic form. The table of this function is given below:
| x | f(x) |
|---|---|
| 1/9 | -2 |
| 1/3 | -1 |
| 1 | 0 |
| 3 | 1 |
| 9 | 2 |
Step 4 The graph of the logarithmic function is given below. You can see that this logarithmic graph is the flipped version of the exponential function graph. 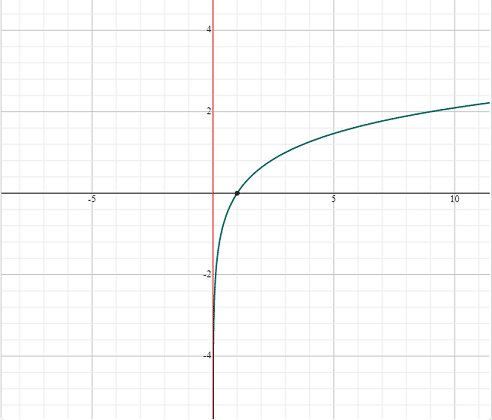
Example 2
Now, let see in another example what happens when the base of the logarithmic function is less than 1. Plot the graph of the function

and its logarithmic form

.
Solution
Step 1 To plot the graphs, first we need to construct the table of exponential function like this:
| x | f(x) |
|---|---|
| -2 | 9 |
| -1 | 3 |
| 0 | 1 |
| 1 | 1/3 |
| 2 | 1/9 |
Step 2 The graph of this function is given below. 
| x | f(x) |
|---|---|
| 9 | -2 |
| 3 | -1 |
| 1 | 0 |
| 1/3 | 1 |
| 1/9 | 2 |
Step 4 The graph of the logarithmic function is given below. 
Example 3
Graph the function

and its logarithmic form

.
Solution
Step 1 Construct a table of the function
.
| x | f(x) |
|---|---|
| -2 | 1/25 |
| -1 | 1/5 |
| 0 | 1 |
| 1 | 5 |
| 2 | 25 |
Step 2 Plot the graph of the exponential function using the above table of values. 
and
of the exponential table.
| x | f(x) |
|---|---|
| 1/25 | -2 |
| 1/5 | -1 |
| 1 | 0 |
| 5 | 1 |
| 25 | 2 |
Step 4 We will get the following graph by plotting the values in the

plane. 
Summarise with AI:
Did you like this article? Rate it!


 Loading...
As a university professor, I always send my students to your websites to study key ideas that you explain in simple terms. You certainly do competent work.