Introduction
Humans are naturally wired to see patterns — we often link events, behaviours, or numbers and wonder if they’re connected.
In statistics, this idea is formalised through correlation, a measure that quantifies the strength and direction of a relationship between two variables.
For example, ice cream sales and shark attacks might both increase in summer, showing a positive correlation, but that doesn’t mean one causes the other.
This is a crucial lesson in statistics: correlation does not imply causation.
The correlation coefficient, usually represented by r, measures how strongly two variables are related.
Correlation Coefficient Formula
For two variables X and Y, the Pearson correlation coefficient is given by:
Where:
 is the mean of the x-values
 is the mean of the y-values
 - ranges from -1 to +1
Interpretation:
 : Perfect positive correlation
 : No correlation
 : Perfect negative correlation


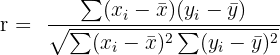
Visual Interpretation of Correlation
| Graph Type | Correlation (r) | Description |
|---|---|---|
| A | 1.0 | Perfect positive correlation — as one variable increases, so does the other. |
| B | 0.6 | Moderate positive correlation — upward trend with some variation. |
| C | 0.0 | No correlation — no linear relationship between the variables. |
| D | -0.6 | Moderate negative correlation — one increases as the other decreases. |
| E | -1.0 | Perfect negative correlation — all points lie on a downward line. |
Practice Problems and Solutions
Problem 1
Calculate and interpret the correlation coefficient for the following data:
| Person | Hand Span (cm) | Height (cm) |
|---|---|---|
| A | 17 | 150 |
| B | 15 | 154 |
| C | 19 | 169 |
| D | 17 | 172 |
| E | 21 | 175 |
Solution
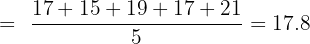
Step 1: Calculate the means:
Step 2: Compute deviations and products:
| Person | x−x̄ | y−ȳ | product | (x−x̄)² | (y−ȳ)² |
|---|---|---|---|---|---|
| A | -0.8 | -14.0 | 11.2 | 0.6 | 196.0 |
| B | -2.8 | -10.0 | 28.0 | 7.8 | 100.0 |
| C | 1.1 | 5.0 | 5.9 | 1.4 | 25.0 |
| D | -0.8 | 8.0 | -6.4 | 0.6 | 64.0 |
| E | 3.2 | 11.0 | 35.2 | 10.2 | 121.0 |
Totals:
Σ(x−x̄)(y−ȳ) = 74.0
Σ(x−x̄)² = 20.8
Σ(y−ȳ)² = 506.0
Step 3: Substitute into the formula:
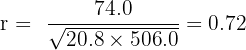
Interpretation:
There is a strong positive correlation between hand span and height. Taller individuals tend to have larger hand spans.
Problem 2
Calculate and interpret the correlation coefficient for the following data:
| Person | Weight (kg) | Blood Pressure (mmHg) |
|---|---|---|
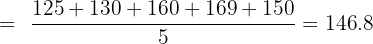
| A | 150 | 125 |
| B | 169 | 130 |
| C | 175 | 160 |
| D | 180 | 169 |
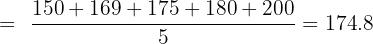
| E | 200 | 150 |
Solution
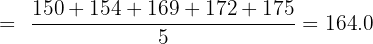
Step 1: Calculate the means:
Step 2: Compute deviations and products:
| Person | x−x̄ | y−ȳ | Product | (x−x̄)² | (y−ȳ)² |
|---|---|---|---|---|---|
| A | -24.8 | -21.8 | 540.6 | 615.0 | 475.2 |
| B | -5.8 | -16.8 | 97.4 | 33.6 | 282.2 |
| C | 0.2 | 13.2 | 2.6 | 0.0 | 174.2 |
| D | 5.2 | 22.2 | 115.4 | 27.0 | 492.8 |
| E | 25.2 | 3.2 | 80.6 | 635.0 | 10.2 |
Totals:
Σ(x−x̄)(y−ȳ) = 836.8
Σ(x−x̄)² = 1310.8
Σ(y−ȳ)² = 1434.8
Step 3: Substitute into the formula:
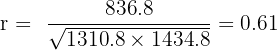
Interpretation:
There is a moderate positive correlation between weight and blood pressure — as weight increases, blood pressure tends to rise.
Problem 3
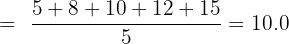
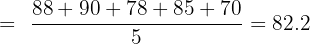
Calculate and interpret the correlation coefficient for the following data:
| Person | Screen Time (hr) | Exam Score (%) |
|---|---|---|
| A | 5 | 88 |
| B | 8 | 90 |
| C | 10 | 78 |
| D | 12 | 85 |
| E | 15 | 70 |
Solution
Step 1: Calculate the means:
Step 2: Compute deviations and products:
| Person | x−x̄ | y−ȳ | Product | (x−x̄)² | (y−ȳ)² |
|---|---|---|---|---|---|
| A | -5.0 | 5.8 | -29.0 | 25.0 | 33.6 |
| B | -2.0 | 7.8 | -15.6 | 4.0 | 60.8 |
| C | 0.0 | -4.2 | -0.0 | 0.0 | 17.6 |
| D | 2.0 | 2.8 | 5.6 | 4.0 | 7.8 |
| E | 5.0 | -12.2 | -61.0 | 25.0 | 148.8 |
Totals:
Σ(x−x̄)(y−ȳ) = -100.0
Σ(x−x̄)² = 58.0
Σ(y−ȳ)² = 268.8
Step 3: Substitute into the formula:
Interpretation:
There is a strong negative correlation between screen time and exam score: as screen time increases, exam scores tend to decrease.
Conclusion
Correlation helps us understand whether two variables move together — and how strongly.
A positive correlation means they rise together, a negative correlation means one rises while the other falls, and a zero correlation means no relationship at all.
This concept forms the basis of regression analysis, which allows us to make predictions using real data.
Summarise with AI:
Did you like this article? Rate it!


Very Helpful. Thanks you guys for good job done to many
Thank you and I want to download these.
How is it?
Very nice and easy way.
Well explained.