






Definition of a Variable

The image above presents a perfect example of a variable which is the level of satisfaction people feel towards a shampoo product. This variable is measured by asking people o fill in a survey rating their satisfaction level from 1 to 5.
| Type | Other Names | Description | Example |
| Quantitative | Numeric | A variable that deals with quantities | Height, number of births, age |
| Qualitative | Categorical | A variable that deals with the qualities of something | Satisfaction level, colour, gender |
Above, you can see the two main types of variables: categorical and numeric type. In our example, the variable is a categorical, or qualitative, variable. Qualitative variables can be broken down further.
| Type | Description | Example |
| Dummy | A categorical variable converted to numbers to be used in analysis | Gender coded as Female = 1 and Male = 0 |
| Nominal | A categorical variable whose categories have no predetermined order or scale | Eye colour, t-shirt brand |
| Ordinal | A categorical variable whose categories have an order or follow a scale | Satisfaction level, economic status, income level |
As you can see in the table above, there are three subtypes within qualitative variables. In addition to this, we must distinguish between the sample and the population. While the population includes all the things, people or places we want to measure - a sample is only a subset of the population.
The example above illustrates that for our example variable, the entire population actually has a satisfaction level of 3.5. However, because it is impossible to measure the variable for our entire population, we get an estimate of 4.1.

Analyse Two Numerical Variables
While an analysis using only two variables can seem too simple to reveal anything interesting, this type of analysis is actually the most common one performed. You can learn a lot by focusing in on only two variables. Take a look at the picture below to get a better idea of the type of analysis you can perform.
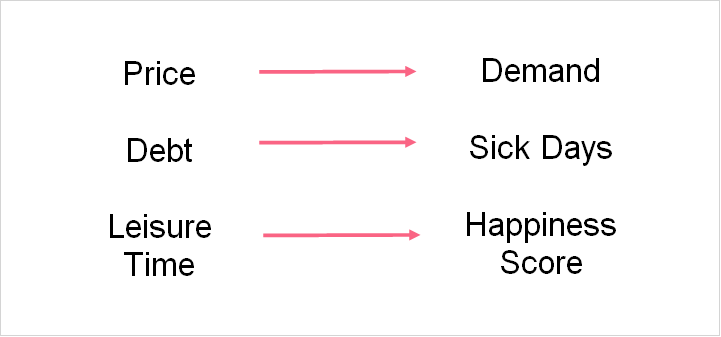
Some of the most common types of statistics you can use to analyse two variables are summarized in the table below with examples.
| Statistic Method | Description | Example |
| Regression | Building a model where one variable is used to predict the other | A regression model that uses price to predict demand |
| Correlation Coefficient | A measure of the strength of the relationship between two variables | Measuring the strength of the linear relationship between pizza sales and number of birthday parties |
| Two Sample t-test | Comparing the means of the same variable from two populations | Comparing the mean test score of two different schools |
Regression
A regression model is a statistical model that can be used to examine the relationship between one response variable and one or more explanatory variables.
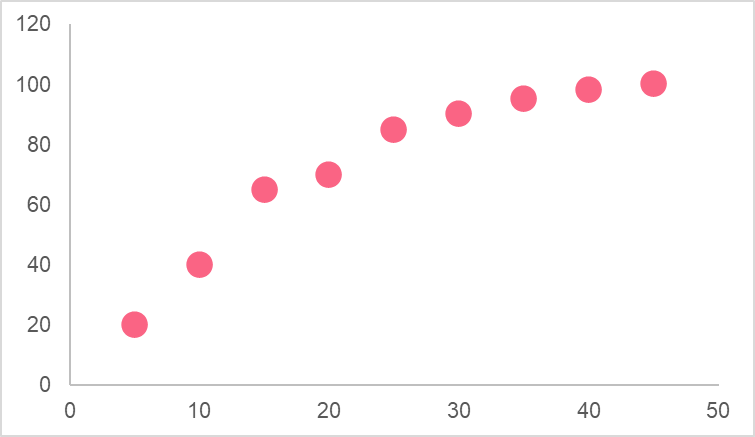
In the image above, you can see the number of cars at a state beach plotted by the temperature on the given day. These two numeric variables exhibit a linear relationship, which we can take advantage of in our linear regression model.


| 1 | Response Variable | Variable we want to study | Cars |
| 2 | Constant | The constant in our regression model | bo |
| 3 | Regression coefficient | The change in number of cars with an increase of 1 C | b1 |
| 4 | Explanatory variable | The variable we use to predict the response variable | Temperature |
Correlation Coefficient
The formula for the correlation coefficient can be seen below.

This statistic measures the strength of the linear relationship between two variables. The image below illustrates how you should interpret this statistic.

| Correlation coefficient | Interpretation |
| 0.3 | There is a very weak, positive relationship between temperature and number of cars at the beach |
| 0.7 | There is a strong, positive relationship between temperature and number of cars at the beach |
Test on Means
A two sample t-test allows you to compare whether or not the means of two populations are equal or not. This is helpful when you’re trying to test whether or not a certain characteristic is more present in one group over another. The table below has some examples.
| 1 | Body temperature | Difference in mean body temperature between a group of men and women |
| 2 | Heart rate | Difference in mean heart rate between a group of professional athletes and non-athletes |
| 3 | Disease | Difference in mean disease rate between a group of patients who took a drug versus a placebo |
Analyse One Numerical and One Categorical Variable
There is a lot of fun that comes with analysing the relationships between categorical and numeric variables. Check out the table below for some examples.
| Numeric | Categorical | Relationship |
| Test score | Extracurricular activities | Does the type of extracurricular activity you take part in help predict your test score? |
| Income | Study major | Does the field you majored in have an association with your income level? |
ANOVA
One of the ways you can analyse the relationship between a categorical and numeric variable is to conduct an analysis of variance test, or ANOVA. This test is similar to a two sample t-test, in that it compares the means of groups.
The major difference is that ANOVA compares the means of two or more groups. Take a look at the example below.
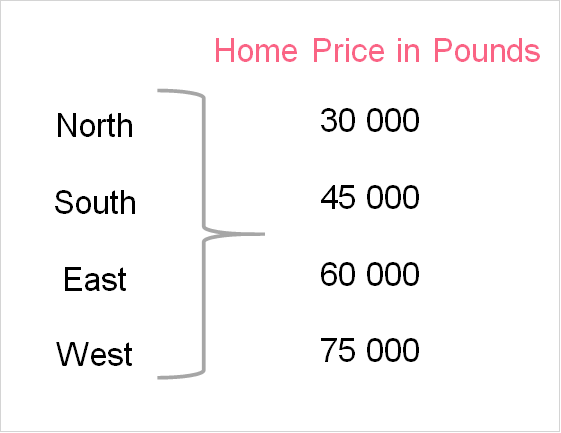
This example shows the mean house price in each region. The table below shows how to interpret an ANOVA.
| Null Hypothesis | There is no significant difference between the mean house prices in each region |
| p > 0.05 | Fail to reject Ho |
| p < 0.05 | Reject Ho |
Analyse Two Categorical Variables
One of the ways you can analyse the relationship between two categorical variables is through a two-way table and chi-square test. Take the following table as an example.
| Female | Male | |
| Science Major | 456 | 350 |
| Literature Major | 240 | 600 |
| Total | 696 | 950 |
Here, we perform a chi-square test, which tests the association between the rows and columns in our 2-way table.

Using the above statistic, we can determine whether or not there is an association between major and gender.
Summarise with AI:
Did you like this article? Rate it!


 Loading...
Very Helpful. Thanks you guys for good job done to many
Thank you and I want to download these.
How is it?
Very nice and easy way.
Well explained.