Types of Variables
| Numerical | Categorical | |
| Definition | Variables which are quantitative characteristics of a thing, place or group | Variables which are qualitative characteristics of a thing, place or group |
| Other names | Quantitative variables | Qualitative variables |
| Examples | Height, age, score | Hair colour, personality, location |
Within these two general categories, there are several sub-categories that can be used to further specify what kind of variable we’re dealing with. These sub-categories are displayed in the image below. 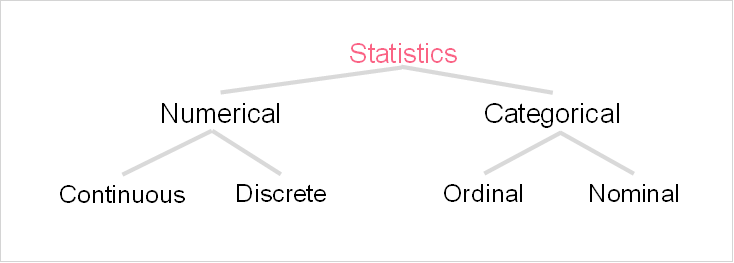
| Discrete | Continuous | |
| Definition | Mutually exclusive categories, typically integers | Can take on infinitely many values within a range of numbers |
| Example | Age in years as an integer. This could be anything from 0 to 100. | Age in years as an exact measurement. This would be, for example, age in years, days, and seconds. |

| Nominal | Ordinal | |
| Definition | A qualitative characteristic with no inherent order | A qualitative characteristic with an inherent or given order (on a scale) |
| Example | Hair colour | Satisfaction rating |

Types of Analysis
Understanding what type of variables you have in your dataset is the first step in analysing data. It is important because it enables you to understand what types of analysis you will be able to run. Recall that statistics is divided into two branches: inferential and descriptive. 
| Univariate (1 variable) | Bivariate (2 variables) | Multivariate (3+ variables) | |
| Numerical | Mean, median, mode, standard deviation, percentiles | Simple linear regression, scatterplot | Multiple linear regression, ANOVA, cluster analysis |
| Categorical | Pie chart, bar chart, frequency | Contingency table | Social network analysis, discriminant analysis |
| Numerical & Categorical | - | Bar chart, z-test or t-test | Logistic regression, ANOVA |
Frequency
Frequency is one of the statistics that you can use in order to analyse how often something occurs. Frequency is defined quite simply as the number of times something happens. Let’s take the following table as an example, where the count for the times someone is chose a given fruit as their favourite appears.
| Fruit | Count |
| Apple | IIIII IIIII II |
| Banana | III |
| Orange | IIIII |
| Peach | IIIII III |
Can you guess what the frequency for each fruit would be? It’s as simple as summing all of the counts in relation to a given fruit. This means that the frequency would be the following.
| Fruit | Count | Frequency |
| Apple | IIIII IIIII II | 12 |
| Banana | III | 3 |
| Orange | IIIII | 5 |
| Peach | IIIII III | 8 |
Frequency typically goes hand in hand with visualizations such as bar charts or histograms. You can think about frequency as a way to translate a categorical variable into a numerical one. Because the frequency of a qualitative variable is a quantity, it can be plotted easily.

Types of Frequency
There are actually several types of frequency. The one we calculated is the simplest form of frequency. There are three more types of frequency apart from this one, although all require finding the simple frequency first.
- Row Frequency
- Column Frequency
- Cumulative Frequency
In order to find these frequencies, let’s elaborate on the previous example, dividing each preference of fruit by gender.
| Female | Male | Other | Row Total | |
| Apple | 4 | 7 | 1 | 12 |
| Banana | 1 | 2 | 0 | 3 |
| Orange | 2 | 1 | 2 | 5 |
| Peach | 3 | 2 | 3 | 8 |
| Column Total | 10 | 12 | 6 | 28 |
In order to find the row frequency, you simply take the value in each row and divide it by the row total. The column total, on the other hand, is found by dividing each value by the column total. The image below explains this process using the first value. 
| Female | Male | Other | Total | |
| Apple | 33.3% | 58.3% | 8.3% | 100% |
| Banana | 33.3% | 66.7% | 0.0% | 100% |
| Orange | 40.0% | 20.0% | 40.0% | 100% |
| Peach | 37.5% | 25.0% | 37.5% | 100% |
The column frequency, on the other hand, is found in the following table.
| Female | Male | Other | |
| Apple | 40.0% | 58.3% | 16.7% |
| Banana | 10.0% | 16.7% | 0.0% |
| Orange | 20.0% | 8.3% | 33.3% |
| Peach | 30.0% | 16.7% | 50.0% |
| Total | 100.0% | 100.0% | 100.0% |
Contingency Table Definition
Another way to think about row and column frequencies is in terms of probability. Recall that the formula for simple probability is the number of times something can occur over the total number of possibilities. A contingency table is a way to analyse two categorical variables, like we did in the previous example tables, by analysing their frequencies. These types of frequencies translate to what is known as conditional probabilities. Conditional probabilities are probabilities between two variables that are dependent on one another. Another word for dependent is contingent, which is where the term contingency table comes into play. Why are these variables contingent on one another? Think about the way we divided up the total between the three categories of gender. The frequency we calculated is related to not just one variable, but both variables - fruit and gender. The difference with a contingency table and what we calculated in the previous tables is that the contingency table uses the total of the whole table instead of the row or column total.
Contingency Table Example
Let’s continue from the previous example dealing with fruit and gender. The total frequency, which is either the sum of all row totals or the sum of column totals, is used as our denominator for our probability formula. The first few values are calculated as examples. Notice that all values are now probabilities of the total of all frequencies.
| Female | Male | Other | Row Total | |
| Apple | 4/28 = 0.143 | 7/28 = 0.25 | 3.6% | 42.9% |
| Banana | 1/28 = 0.036 | 7.1% | 0.0% | 10.7% |
| Orange | 7.1% | 3.6% | 7.1% | 17.9% |
| Peach | 10.7% | 7.1% | 10.7% | 28.6% |
| Column Total | 35.7% | 42.9% | 21.4% | 100.0% |
Summarise with AI:
Did you like this article? Rate it!


 Loading...