Measures of Central Tendency
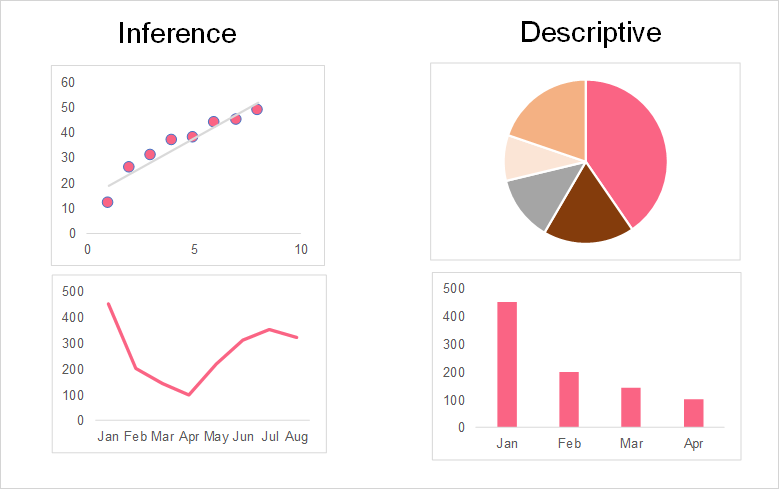
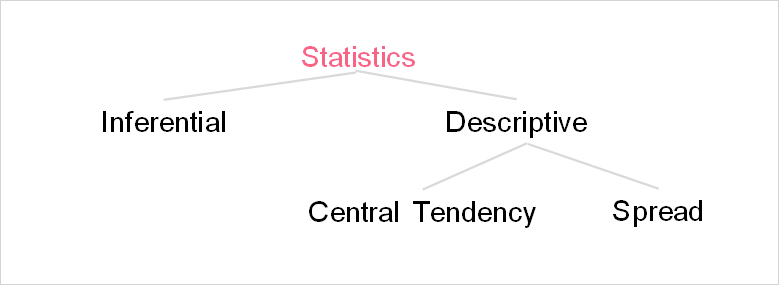
While statistics can often be thought of as one general clump of metrics and data, there are actually two major branches within the field. These two distinct branches are: inferential and descriptive statistics. Inferential statistics involve the tools and methods used to predict the future using the data that you have. Descriptive statistics, on the other hand, involve using methods and crafting visualizations that describe the data set.
| Measure | Definition | Example | Formula |
| Mean | The average of a variable | The average amount of rain in a year |  |
| Median | The middle point of a variable | The median salary is 13,000 pounds | Order data from least to greatest, pick the middle |
| Mode | The most frequently occurring value of a variable | The mode dessert of a restaurant is cake | Calculate the frequency and pick the one with the highest frequency |
Measures of Spread
In contrast to measures of central tendency, measures of spread are descriptive statistics that can help us understand how far spread the data is around the centre point. As you can see, measures of spread work hand in hand with measures of central tendency. You cannot talk about measures of spread without the mean, median or mode. The three major types of spread measures are the standard deviation, variance and range. A definition, formula and example for each can be found in the table below.
| Measure | Definition | Example | Formula |
| Standard deviation | How far spread apart the data is from the mean | The standard deviation of running times is 3.4 seconds | 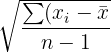 |
| Variance | The variance is the average amount between all observations and the mean | The variance of running times is 11.56 seconds squared |  |
| Range | The difference between the highest and lowest values in a variable | The range in running times is 60 seconds |  |
Median Definition
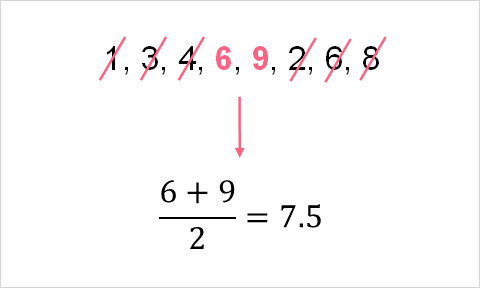
Recall that the median is actually one of the measures of central tendency. The median is defined as the middle point of a variable. Because the median is considered to be the midpoint of a variable, it is the exact point that represents a separation between the upper half and lower half of the values within a variable. 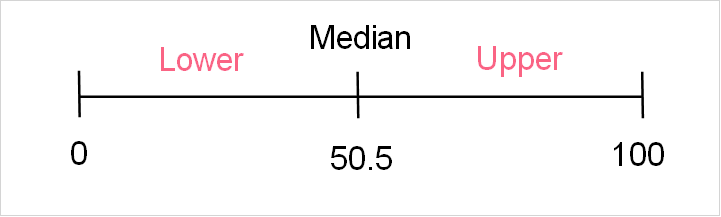
How to Find the Median
Finding the median is quite simple. While there are several formulas you will find for the median, the easiest way to calculate it is to do it by hand. The following table goes through each step in finding the median.
| Step | Description | Example |
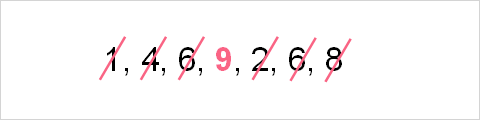
| 1 | Start with one variable with numerical values | 1,4,6,9,2,6,8 |
| 2 | Order the values from least to greatest | 1,2,4,6,6,8,9 |
| 3 | Extract the middle value if there are an odd number of observations for the variable | 6 |
Median Example
This section will give a step by step example of finding the median. Let’s start with a practice data set. The following table has the amount of time it takes to go from 0 to 60 miles per hour, a common benchmark for automobile performance.
| No. | Car | 0-60mph |
| 1 | Porsche 918 Spyder | 2.1 |
| 2 | Lamborghini Diablo SE | 4.0 |
| 3 | Bugatti Veyron | 2.5 |
| 4 | BMW 6 Series 4.4 V8 | 3.8 |
| 5 | Ferrari 488 Pista | 2.7 |
| 6 | Honda NSX | 3.0 |
| 7 | McLaren 720S | 2.5 |
| 8 | Jaguar F Type R | 3.9 |
| 9 | Tesla Model S P 100D | 2.28 |

When to Use the Median
The median should be used instead of the mean whenever your data set is highly skewed. Take the previous data set as an example, adding a few more cars to the list.
| No. | Car | 0-60mph |
| 1 | Porsche 918 Spyder | 2.1 |
| 2 | Lamborghini Diablo SE | 4.0 |
| 3 | Bugatti Veyron | 2.5 |
| 4 | BMW 6 Series 4.4 V8 | 3.8 |
| 5 | Ferrari 488 Pista | 2.7 |
| 6 | Honda NSX | 3.0 |
| 7 | McLaren 720S | 2.5 |
| 8 | Jaguar F Type R | 3.9 |
| 9 | Tesla Model S P 100D | 2.28 |
| 10 | Renault 25 2.5 V6 | 7.9 |
| 11 | Subaru BRZ 2L | 7.9 |

Summarise with AI:
Did you like this article? Rate it!


 Loading...