Measures of Central Tendency
In probability theory, there are several ways to analyse a random variable. Recall that the branch of probability is concerned with random phenomena, which can be thought of random variables whose outcomes are unknown. There are several ways you can analyse a random variable. However, we can split these measures into two general categories: measures of central tendency and spread. 
Measures of Spread
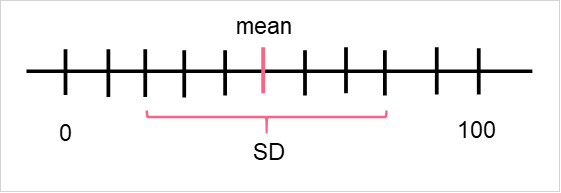
Measures of spread are the second class of measures in probability theory. Their name also gives us a hint as to what they’re used for: measuring the dispersion of the data set. The most common measures include: standard deviation, variance, range, interquartile range/percentiles. To understand this concept, let’s take a look at two sets of data with the same mean but different standard deviations. 
Percentiles
Percentiles are a powerful measure of spread. You will sometimes see percentiles called a measure of location as well. Regardless of which term you decide to use, they can be very helpful in understanding the distribution of your data, especially when you have very large data sets. 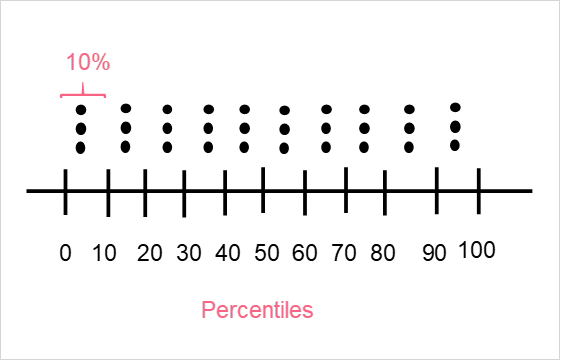
| Percentile | Description | Use |
| Deciles | Each interval contains 10% of the data | Want to have detailed understanding of distribution |
| Quartiles | Intervals contain 25% of the data | Want quartile characteristics, such as the median |
| 20th, 40th, 60th, 80th Percentiles | Intervals contain 20% of the data | Want a broad overview, can compare top 20% to the bottom 20% |
How to Find Percentiles
Finding percentiles is usually very dependent on the software you’re choosing to find it with, as most programs have different formulas or locations in the menu for it. However, if you’re dealing with a simple data set, finding the percentiles by hand can be pretty easy.
| Student | Score |
| 1 | 40 |
| 2 | 45 |
| 3 | 60 |
| 4 | 67 |
| 5 | 75 |
| 6 | 80 |
| 7 | 85 |
| 8 | 88 |
| 9 | 89 |
| 10 | 90 |
| 11 | 91 |
Say you’re interested in knowing the deciles for this data. There are three main methods you can use to calculate percentiles:
| Notation | Description | Other Names | |
| Greater than | k > percentiles | Find the lowest value greater than k | Excluding |
| Equal or greater than | k >= percentile | Find the value = k or lowest value greater than k | Including |
| Weighted average | N/a | Find the two above and calculate the weighted average | Interpolation |
Here, we use the second method, which is sometimes known as “including,” as it includes the value at k. Keep in mind that k is equal to the percentiles we want to take. Because we want to take deciles, k would be equal to every 10 values (k=10, k=20, k=30…). Because we have 11 values, it is quite easy: every other value will contain 10 percent of the data.
| Percentile | k | Value |
| 10 | 0.1 | 45 |
| 20 | 0.2 | 60 |
| 30 | 0.3 | 67 |
| 40 | 0.4 | 75 |
| 50 | 0.5 | 80 |
| 60 | 0.6 | 85 |
| 70 | 0.7 | 88 |
| 80 | 0.8 | 89 |
| 90 | 0.9 | 90 |
| 100 | 1 | 91 |
This was easy, because we had an odd number of values. Take a look at the image below to clarify the percentiles we found. 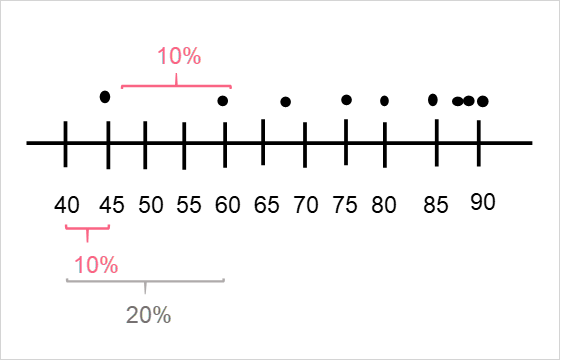
Interpret Percentiles
In order to interpret any percentile, let’s take a look at an example. 
When to Use Percentiles
You should use percentiles when you’re interested in:
- Knowing the distribution of your data
- Comparing different groups of values within your data
Take a look at the two images below.
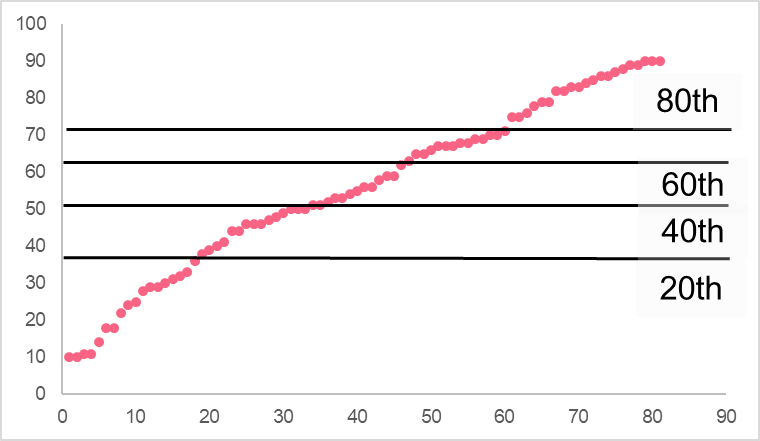

While the range is the same for both sets of data, with each going from 10 to 90, the distribution of the values is very different. In the first image, the bottom 20% of the data is contained between 10 and 33 while the top 20% is contained between 79 and 90. On the other hand, the second image has the bottom 20% between 10 and 44 while the top 20% are between 86 and 90. Here, we compared the distributions between two data sets and also compared the values between different percentiles.
Common Percentiles
The most common percentiles are often used because they tell us important information about the data. The most common ones are listed below.
| Name | Description | Use | |
| 10th | Deciles | Gives a detailed view of the data | Can group each 10th to compare top 10, bottom 30, etc. |
| 20th | - | Useful for broad overviews of the data | Can compare top 20% and bottom 20% |
| 25th | Quartiles | Gives us information about each quarter | Gives the bottom 25%, the median, and top 25% |
| 30th | - | Gives information about each third | Gives a third of the data |
Boxplot
Boxplots are common in descriptive analysis: they give us information about the quartiles. The image below shows an example. 
| Quartile | |
| A | 0th |
| B | 25th |
| C | 50th |
| D | 75th |
| E | 100th |
Interpret Boxplots
In order to interpret the boxplot, you should use an example.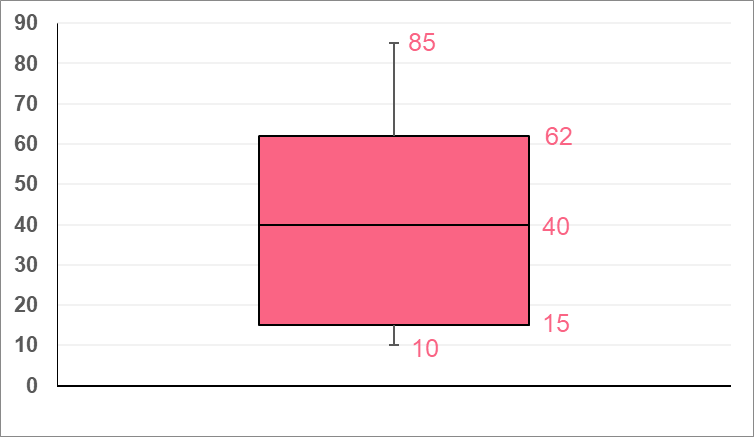
| Quartile | Interpretation | |
| 10 | 0th | Minimum |
| 15 | 25th | Points above are greater than 25% of the data |
| 40 | 50th | Median |
| 62 | 75th | Points above are greater than 75% of the data |
| 85 | 100th | Maximum |
Summarise with AI:
Did you like this article? Rate it!


 Loading...