In this article, we will use the t-test to compare the means of two different samples. Before proceeding to discuss how to compare the means of two different samples using a t-test, first, let us discuss what is the t-test.


What is a T-test?
A statistical test known as a t-test can be employed to compare the means of two sets of data. It can also be used to determine the significance of the means. A t-test refers to a test of a statistically significant difference between two groups. Now, you may be wondering what does a “significant difference” mean? Well, a significant difference refers to the results that are observed and are mostly not because of the chance or errors in sampling. Any observation or experiment involving the sampling from a population includes the probability that any seen effect could have occurred because of the sampling error. However, in case of a significant result, an investigator can conclude that any observed result depicts the characteristics of the population instead of the chance or sampling error.
T-test Data Sets Conditions
Now, let us see what conditions the data sets should meet in order to qualify for the t-tests.
The data sets must meet the following conditions:
- They should follow a roughly normal distribution
- The data sets must be continuous
- The standard deviations of the data sets must be approximately equal
Before carrying out the t-tests, the standard deviation(s) should be calculated for each data set.
A null hypothesis should also be given which refers to the statement of what you can expect if the means of the data sets have no significant difference, then any differences observed are because of chance. In case there is no visible difference between the means of the two data sets, then the observation made is not due to chance and you can reject the null hypothesis.
In the next section, you will find the formula for computing the standard deviation.
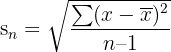
The formula for Computing the Standard Deviation
The formula for computing the standard deviation is given below:

Here:
- S stands for standard deviation
- X stands for observation
 stands for mean
- n stands for sample size, i.e number of observations
 stands for the sum of
In the next step, we will discuss how to use a t-test to compare two means.
How to Use t-test to Compare two Means?
Let us recall what is null hypothesis before proceeding to discuss the steps involved in a t-test.
According to the null hypothesis, there is no statistically visible difference between the means of sample 1 and sample 2.
The examples of null hypothesis are given below:
Example 1: There is no significant difference between the growth of the plants which were treated with mineral and distilled water; the difference we see in the means of the two groups can be due to the chance and sampling error.
Example 2: There is no significant difference between the blood sugar level before and after the treatment; the difference we see in the means of the two groups is possibly due to the chance and sampling error.
Example 3: There is no significant difference between hyperactivity of children before and after the medicine; the difference we observe in the means of the two groups is probably due to the sampling error and chance.
The opposite of the null hypothesis is an alternate hypothesis. The difference between null and alternate hypotheses is reflected by the following diagram:

Steps Involved in a T-test
Follow the steps below to conduct a t-test:
Step 1: For each data set, calculate its mean
Here,  will represent the mean for sample 1, and
  will represent the mean for sample 2
Step 2: For each data set, calculate its standard deviation. The standard deviation of sample 1 is represented by  and the standard deviation of sample 2 is represented by
Step 3: In this step, we will take a square of the standard deviation and divide that value by n which represents the number of observations in each sample. We will do this for both samples.
 and
and 
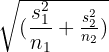
Step 4: Take an aggregate of the values obtained in step 3 and take the square root:
Step 5: In this step, we will divide the difference between two means with the value obtained in step 4 to get the t value:
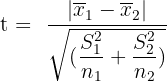
Here:
 represents the mean of sample 1
 represents the mean of sample 2
 represents the squared standard deviation of sample 1
 represents the squared standard deviation of sample 2
 represents the number of each measurement in sample 1
 represents the number of each measurement in sample 2
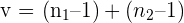
Step 6: Compute the degrees of freedom represented by v for the entire data set. The formula for degrees of freedom is given below:
Step 7: See the table in which the t values are related to the probability. The difference between the data sets is because of the probability. In this table, look where the t value for the degrees of freedom (v) which was computed lies
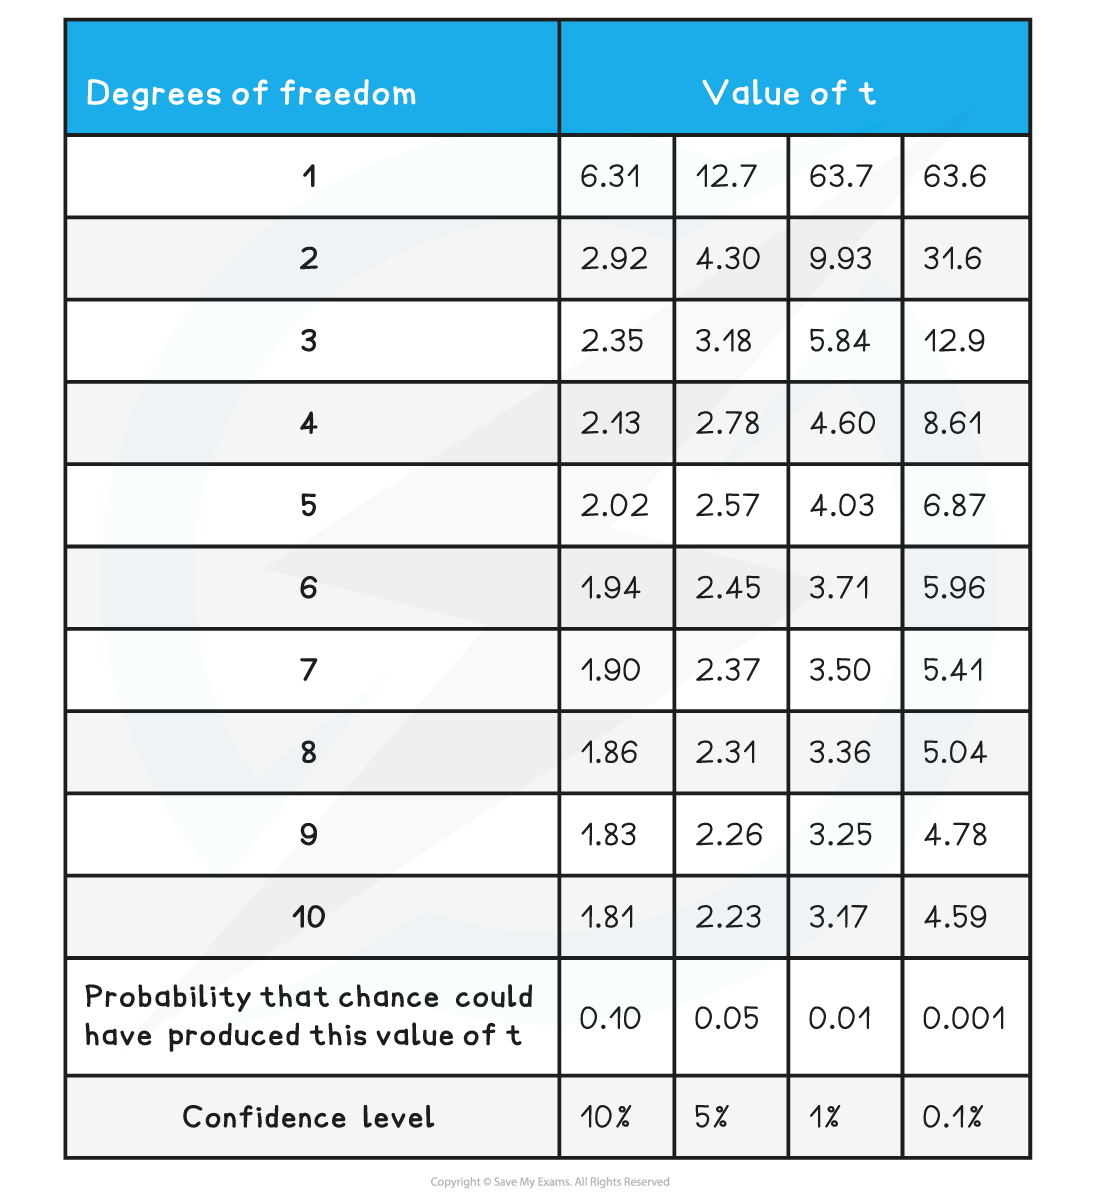
Step 8: If the calculated t value is greater, then the probability of chance causing any visible difference between the two sample means is lower:
- Find where the calculated t value lies with respect to the provided confidence level
- In case the t value is greater than the critical value (this value was obtained from the table at the critical probability of 0.05), then there is a low probability that any existing difference between the two data sets is due to chance. Hence, we can reject the null hypothesis.
- In case, the t value is less than the critical value which was given at the confidence of 5% which means that the probability that any difference is due to chance is more than 0.05, then we can assume that there is no significant difference between the means of the two data sets. Hence, the null hypothesis can be accepted.
- Using the above table, if we calculated the value of t to be 2.38 at 5 degrees of freedom, then it lies between 2.02 and 2.57. Hence, the probability that any difference between the two means is between 10% and 5% and that too occurred due to the chance, then the null hypothesis will be accepted.
Summarise with AI:
Did you like this article? Rate it!


