In this article, we will discuss the importance of random sampling in determining the biodiversity of an area. We will also describe and use appropriate methods to evaluate the distribution and abundance of organisms in an area, limited to frame quadrats, line transects, belt transects, and mark-release-recapture using the Lincoln index. So, let us get started.


What is Random Sampling?
It can be a difficult task to measure various levels of biodiversity within an ecosystem. To find the kind of species that inhabit an ecosystem and the population's size, we need to identify and catalogue all the organisms present to create a list of species. It is doable for smaller regions or places where species are extremely large, for instance, trees.
However, some ecosystems are quite complex like the rainforest. For such ecosystems, it can be impossible to find, identify and enumerate every organism that is present there. In such cases, various samples of that area can be taken and employed to estimate the total number of species in that area.
Sampling
Sampling refers to the method of investigating the abundance and distribution of species and populations. There are following two types of sampling:
- Random sampling: In this type of sampling, the sampling points' positions are completely random or due to chance. The advantage of this method is no bias by a person that carries out the sampling that may influence the results.
- Systematic sampling: In this type of sampling, the person who carries out the sampling selects the positions of sampling points. Unlike random sampling, there is a chance that a person may show a bias towards or against some areas. There is also a possibility that a person may place the quadrates in areas having the least species so that they can be counted easily and quickly. Consequently, this sampling will not represent the entire area.
Random sampling is the best option if the sampling area is reasonably uniform or shows no clear patterns in the way the species are distributed.
How to Test for Distribution and Abundance?
- Species distribution: The distribution of a species tells us how it is spread throughout the ecosystem.
- Species abundance: The abundance of species refers to the number of individuals of that species.
The distribution and abundance of a species in a specific area can be evaluated using the following practical methods:
- Frame Quadrats
- Line and Belt Transects
- Mark-release-capture
Frame Quadrats
Some ecosystems are extremely complex and contain a huge number of different species of different sizes. For logistic sake, sampling is employed often to assess the distribution and abundance of species.
When sampling is accrued out, quadrats which are the square frames are employed to mark off the area that is being sampled. Quadrats of varying sizes can be employed depending on:
- What is being evaluated?
- What is the most appropriate in the space the samples are being made in?
Quadrats should be randomly laid in the area to prevent sampling bias. We can do this random sampling by converting the sampling area into a grid format and labelling each square on the grid with a number. After that, a random number generator can be employed to pick the sample points. After the quadrat is laid on the selected sample point, the abundance of all the different species presents there can be recorded.
Quadrats Results
The quadrats results can be employed to compute the forecasted frequency and density of the species within an area. We can define species frequency as:
The probability that the species will be present within any quadrat in the sample area.
The quadrat number that the species was present in is divided by the total number of quadrats. The result is then multiplied by 100. For instance, if the bluebells were present in 18 out of 50 quadrats, then the species frequency will be:
18/50 x 100 = 36%
The species density shows the number of members of that species present per unit area.
To find out the species density, the number of individuals counted across all quadrats is divided by the total area of all the quadrats. For instance, if 107 bluebells are present across 50 quadrats that are 1m2 each, then the species density will be:
107/50 = 2.14 members per m2
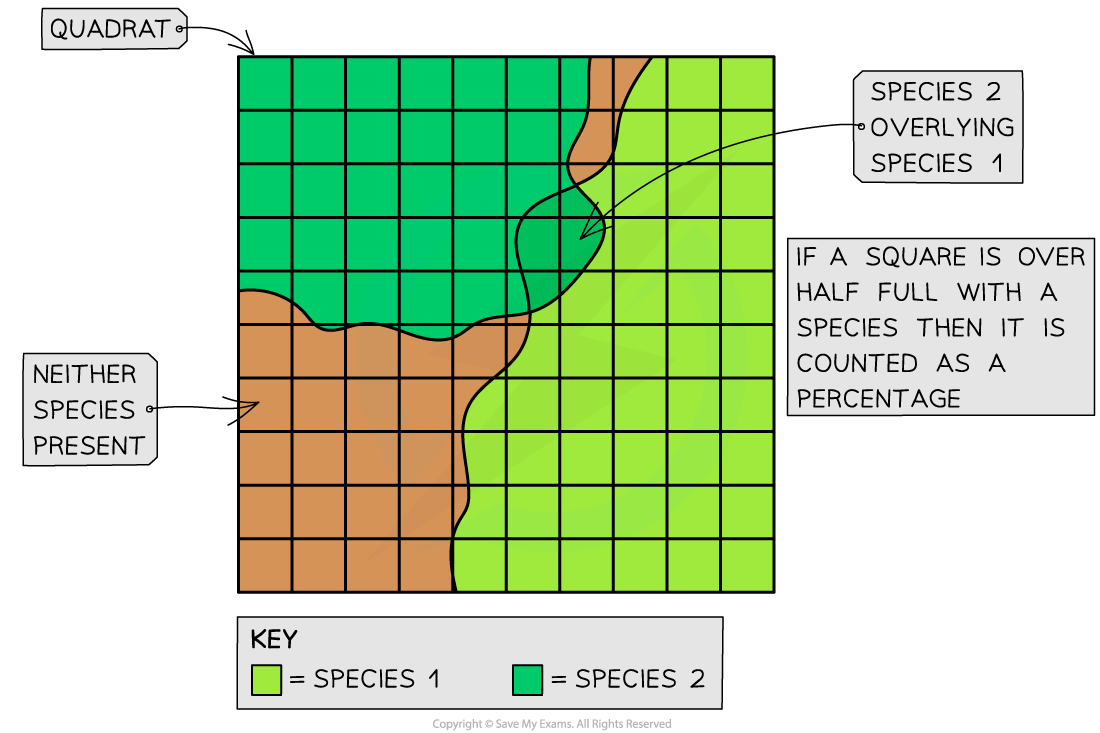
Sometimes it can be hard to count individual plants or organisms. In this case, the percentage cover of the species within the quadrat can be calculated instead.
After dividing the quadrat into 100 smaller squares, the number of squares the species is present in is equal to its percentage cover in that specific quadrat. For instance, if the grass is present in 89 out of 100 squares in a quadrat, then the percentage cover will be 89%.
Line and Belt Transects
Physical conditions can change throughout some areas. For instance, altitude, soil pH, or intensity of light can change. When investigating the species distribution in these types of areas, systematic sampling is more suitable as compared to random sampling.
Methods that employ transects assist in showing how species distribution changes with various physical conditions in that area. We can define transect as:
A line represented by a measuring tape along which the samples are taken is known as a transect.
Line transect
- To use this method, lay out the measuring tape in a straight line across the sample area.
- Record the identity of the organisms that touch the line at equal distances along the tape. For instance, record the identity at every 2m.
- This generates qualitative data
Belt transect
- This method involves placing quadrats at regular intervals along the tape and then recording the abundance of each species within each quadrat
- This generates quantitative data
Mark-release Capture
The above-described methods can only be used for stationary organisms like trees. To calculate the number of individuals in a population of mobile animals various other methods are needed. The mark-release capture method is employed along with the Lincoln Index.
How to use this method?
- Take a large sample and include as many individuals as possible. But remember that one should catch, count, and mark individuals in a way that does not affect their survival.
- Allow them to return to their habitat and randomly mix with the remaining population
- After some time, capture another large sample
- Count the number of marked and unmarked individuals within the sample
- Calculate the size of the population by using the proportion of marked to unmarked individuals
- Use the following formula for calculation:
N = n1 x n2 / m2
In the above formula:
- N represents the population estimate
- n1 depicts the number of marked individuals released
- n2 represents the number of individuals in the second sample (marked and unmarked)
- m2 represents the number of marked individuals in the second sample
Solved Example: Lincoln Index with Mark-release-recapture
Suppose scientists need to investigate the abundance of leafhoppers in a small grassy meadow. They employed sweep nets to capture a large sample of leafhoppers from that grassy meadow. They marked each insect on its underside with non-toxic waterproof paint. After that, they released the insects back to the meadow. The next day, they captured another large sample using the sweep nets.
- Number of captured and marked in the first sample (n1) = 236
- Number of captured individuals in the second sample (n2) = 244
- Number of marked individuals in the second sample (m2) = 71
Using the formula:
N = n1 x n2 / m2
= 236 x 244 / 71 = 811
Estimated size of the population (N) = 811
Summarise with AI:
Did you like this article? Rate it!


