In this article, we will describe and explain the oxygen dissociation curve of adult haemoglobin. We will also explain the importance of the oxygen dissociation curve at partial pressures of oxygen in the lungs and in respiring tissues. Moreover, we will describe the Bohr shift and explain its importance of the Bohr shift. SO, let us get started with the oxygen dissociation curve.


The Oxygen Dissociation Curve
The oxygen dissociation curve explains the rate at which oxygen associates and dissociates with haemoglobin at various partial pressures of oxygen ( ). Now, you may be wondering what is the partial pressure of oxygen. Well, the partial pressure of oxygen can be explained as follows:
The pressure exerted by oxygen within a mixture of gases is known as partial pressure. The partial pressure of oxygen is a measure of oxygen concentration.
We say that the haemoglobin is saturated when all of its oxygen-binding sites are taken up with oxygen. In other words, when it contains four molecules of oxygen.
The affinity of oxygen refers to the ease with which the haemoglobin binds and dissociates with oxygen. We say that the haemoglobin has a high affinity when it binds easily and dissociates slowly. On the other hand, haemoglobin is said to have a low affinity for oxygen when it binds slowly and dissociates easily.
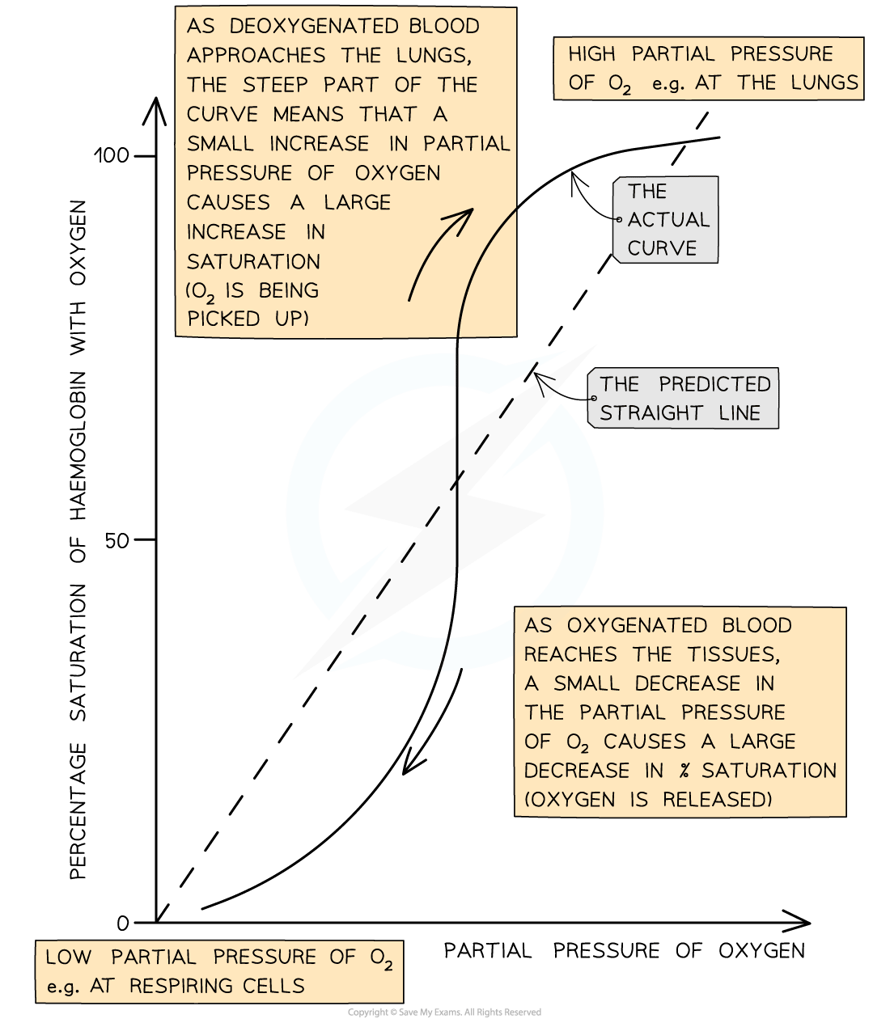
In liquids like water, it is expected that the oxygen becomes associated with water, or dissolves at a constant rate. Thus, when plotted on a graph, we get a straight line. On the other hand, with haemoglobin, the oxygen binds at varying rates with the changes in . Hence, as a result, we get a curve.
We can say that the affinity of haemoglobin for oxygen varies at different partial pressures of oxygen.
How to Interpret the Curve?
Reading Curve From Left to Right
When we read the curve from left to right, we get information regarding the rate at which haemoglobin binds to oxygen at various partial pressures of oxygen.
- At low , oxygen gradually binds to haemoglobin. It is shown in the bottom left corner of the graph. It implies that the haemoglobin cannot pick up oxygen and becomes saturated because blood passes through the oxygen-depleted tissues of the body. At low
 , haemoglobin has a low affinity for oxygen, hence the saturation percentage is low.
 - At medium , oxygen binds more easily to the haemoglobin and there is a quick increase in the saturation. It is shown in the central region of the graph and at this point in the graph, a small increase in will result in a large increase in haemoglobin saturation.
- At high , oxygen binds easily to the haemoglobin. You can see it in the top right corner of the graph. It implies that the haemoglobin can pick up oxygen and become saturated as blood moves through the lungs.
- At high , haemoglobin has a high affinity for oxygen, hence the saturation percentage is high.
- Remember that at this point on the graph, the increase in by a large amount only has a small effect on the saturation percentage of haemoglobin. This is because the majority of the oxygen-binding sites on haemoglobin are occupied already.
Reading Curve from Right to Left
When we read the curve from right to left, the curve gives us information about the rate at which the haemoglobin dissociates with oxygen at various partial pressures of oxygen.
- Since is high in the lungs, hence there is an extremely little dissociation of oxygen from haemoglobin.
- At medium , oxygen dissociates readily from the haemoglobin which is exhibited by the steep region of the curve. This steep region corresponds with the partial pressures of oxygen found in the respiring tissues of the body. Hence, the quick release of oxygen is critical for cellular respiration.
- At this point on a graph, a small decrease in will result in a large decrease in percentage saturation of haemoglobin. As a result, a huge amount of oxygen to the cells is released easily.
- At this point on a graph, a small decrease in
- At low , dissociation slows again. There are only some oxygen molecules that are left on the binding sites and the release of the final oxygen molecule becomes harder.
In the next section of the article, we will explain the oxygen dissociation curve.
Explaining the Oxygen Dissociation Curve
We can explain the curve shape of the oxygen dissociation curve for haemoglobin like this:
- Owing to the shape of the haemoglobin molecule, it is hard for the first oxygen molecule to bind to the haemoglobin. It implies that there is a slow binding of the first oxygen molecule. This phenomenon is explained by the relatively shallow curve at the bottom left corner of the graph.
- After the first oxygen molecule binds to the haemoglobin, there is a change in the shape of the haemoglobin protein. The change in shape makes it easier for the next haemoglobin molecules to bind. This catalyzes (speeds up) the binding of the remaining oxygen molecules. On the graph, it is shown by the steeper region of the curve in the middle of the graph. The change in the shape of the haemoglobin resulting in easier binding of oxygen is referred to as cooperative binding.
- When the haemoglobin molecule approaches saturation, the fourth oxygen molecule takes longer to bind because of the shortage of remaining binding sites. This is explained by the leveling off of the curve in the top right corner of the graph.
In the next section of the article, we will discuss the Bohr Shift in detail.
The Bohr Shift
- Bohr effect or Bohr shift refers to the variation in the oxygen dissociation curve resulting from carbon dioxide levels.
- The haemoglobin’s affinity for oxygen is lessened as a result of the high partial pressure of carbon dioxide in the blood. This case is observed in the respiring tissues, where cells produce carbon dioxide as a waste product of respiration.
- It happens because carbon dioxide lowers the pH of the blood. The combination of carbon dioxide and water creates carbonic acid. Carbonic acid dissociates into hydrogen carbonate and hydrogen ions. The binding of hydrogen ions with haemoglobin results in the release of oxygen.
- This change is helpful because it implies that haemoglobin gives up oxygen more readily in the respiring tissues when it is required. On a graph exhibiting the dissociation curve, there is a shift in the curve to the right with the increase in carbon dioxide levels.
- It implies that at any given partial pressure of oxygen, the percentage saturation of haemoglobin is lower at higher levels of carbon dioxide.
Summarise with AI:
Did you like this article? Rate it!


