In this article, we will discuss how the surface area to volume ratios decrease with increasing size. Moreover, we will also investigate the effect of changing surface area to volume ratio on diffusion using agar blocks. So, let us get started.


Principle of Surface Area to Volume Ratio (SA: V)
Both volume and surface area play a critical role in the exchange of materials in organisms. We can define the surface area as:
The total area of an organism that is exposed to the external environment is known as the surface area
The volume can be defined as:
The total internal volume of the organism which means the total amount of space within the organism is known as volume.
With the increase in surface area and volume of an organism, the overall size of the organism increases. It implies that the surface area to volume ratio decreases. This is due to the reason that as the size increases, the volume increases more quickly than the surface area.
See the figure below in which three cubes of varying sizes are shown.

Volume of the cube A = 1 cm x 1 cm x 1 cm = 1 
Surface area of the cube A = 6 
Surface area to volume ratio (SA: V) = 6: 1
Volume of the cube B = 2 cm x 2 cm x 2 cm = 8
Surface area of the cube A = 24
Surface area to volume ratio (SA: V) = 3 : 1
Volume of the cube C = 3 cm x 3 cm x 3 cm = 27
Surface area of the cube A = 54
Surface area to volume ratio (SA: V) = 2: 1
The above calculations show that as the size of the object increases, the surface area to volume ratio decreases.
In the next section of the article, we will discuss how to use Visking tubing to investigate diffusion.
Using Visking Tubing to Investigate Diffusion
Visking tubing, which is also called dialysis tubing refers to a non-living partially permeable membrane composed of cellulose.
The pores in this partially permeable membrane are sufficiently small to obstruct the passage of large molecules like sucrose and starch. However, these pores allow small molecules like glucose to pass through diffusion.
We can prove it by:
- Using a mixture of glucose and starch to fill a section of visking tubing
- Suspending the tubing in the boiling water tube for a definite time period
- Testing the water that is present outside the visking tubing for the presence of glucose and starch to see if diffusion of any substrate has taken place out of the tubing
- The results should depict that only glucose (not starch) diffuses out of the tubing
Quantitative Investigation
We can investigate it quantitatively by:
- Evaluating the concentration of glucose that has diffused into the water that is present around the Visking tubing at regular time intervals (For every time interval, separate boiling tubes are set up) by employing the semi-quantitative Benedict’s test
We can compare the time intervals using a set of colour standards referred to as glucose concentrations or a colourimeter to yield a more quantitative set of outcomes
A graph depicting how the rate of diffusion alters with the concentration gradient between the inside and outside of the tubing can be drawn as shown below:
In the next section of the article, we will discuss how to investigate the surface area with agar.
Using Agar to Investigate Surface Area
How changing surface area to volume ratio affects diffusion can be investigated by timing the diffusion of ions through agar cubes of varying sizes.
Procedure
Follow the procedure explained below to investigate the change in surface area to volume ratio using agar:
- Create the colored agar and cut it up into cubes of required dimensions (for instance, 0.5cm x 0.5 cm x 0.5 cm or 1 cm x 1 cm x 1 cm or 2 cm x 2 cm x 2 cm)
- You can create the purple agar if it is composed of extremely dilute sodium hydroxide solution and a universal indicator. You can also create the agar with a universal indicator only
- Calculate and record the volume, surface area, and surface area to volume ratio of these cubes
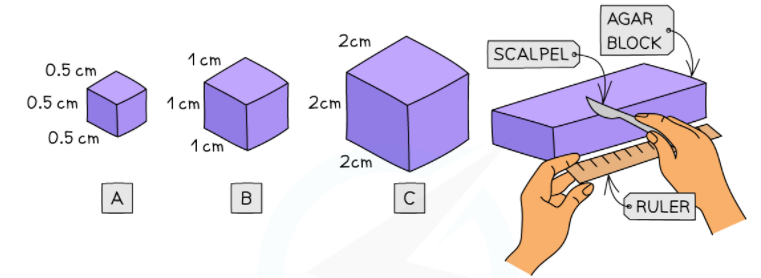
Surface area of cube A = 1.5
Volume of cube A = 0.5 cm x 0.5 cm x 0.5 cm = 0.125
Surface area to volume ratio of cube A = SA: V = 12: 1
Surface area of cube B = 6
Volume of cube A = 1.0 cm x 1.0 cm x 1.0 cm = 1.0
Surface area to volume ratio of cube B = SA: V = 6: 1
Surface area of cube A = 24
Volume of cube A = 2.0 cm x 2.0 cm x 2.0 cm = 8.0
Surface area to volume ratio of cube C = SA: V = 3: 1
- Place these cubes into the boiling tubes that contain a diffusion solution like dilute hydrochloric acid
- A similar volume of dilute hydrochloric acid should be measured carefully in every boiling tube
- The molarity of the acid should be higher than that of sodium hydroxide. This is ensured so that we can monitor diffusion by a change in colour of the indicator in the agar blocks.
- We can measure either:
- The time it takes for the acid to change the colour of the indicator in the agar blocks completely
- How much distance the acid travels in the block in a given time (for instance, 5 minutes)
In the next section, we will discuss how to analyze the results of this experiment.
Analysis of the Results
- We can convert the time into rates if the time it takes for the acid to change the colour of the indicator in the agar blocks is recorded
- We can draw the graph that shows how the diffusion rate varies with the surface area to volume ratio of the agar cubes
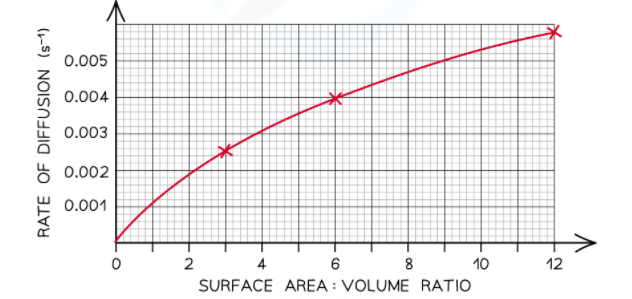
Using the above graph, we can write the following conclusion:
With the increase in surface area to volume ratio of the agar cubes, the diffusion rate through the agar cubes increases. For instance, the smallest surface area to volume ratio is of the cube C which is 3: 1. The rate of diffusion of this cube is 0.0026  . On the other hand, the largest surface area to volume ratio is of cube A which is 12: 1. The diffusion rate of this cube is of 0.0057 .
Summarise with AI:
Did you like this article? Rate it!


