In this article, we will interpret and construct genetic diagrams, including Punnett squares, to explain and predict the results of monohybrid crosses and dihybrid crosses that include dominance, codominance, multiple alleles, and sex linkage. Moreover, we will also interpret and construct genetic diagrams, which include Punnett squares, to explain and predict the results of dihybrid crosses that involve autosomal linkage and epistasis. So, let us get started.


Predicting Inheritance Using Monohybrid Crosses
- Monohybrid inheritance is used to tell how the alleles for a single gene are transferred from one generation to the next
- If the information about genotypes is known, then we can use the phenotypes and the process of meiosis to make predictions about the phenotypes of the child that will be the result of particular breeding pairs
- Two individuals sexually reproducing, share an equal chance of either allele making it into their gametes from their homologous pair and then into the nucleus of the zygote.
- It implies that there is an equal probability that zygote will inherit their allele from their parent
- To make the predictions, genetic diagrams are usually used to present this information concisely
- A characteristic table is included in these diagrams which are referred to as the Punnet square
- The genetic diagrams predict genotypes that are based on likelihood. It means that these diagrams cannot predict which gametes will fuse, so observed or real-life results may be different from what was predicted.
Example: Genetic Diagram of Coat Color of Horses
Suppose one of the genes for the coat colour of horses has the two alleles listed below:
- When a dominant allele, B, is present, it produces a black coat
- When a recessive allele b is present in a homozygous individual, it produces a chestnut coat
In the above example, a heterozygous male crosses with the heterozygous female.
Monohybrid Punnett Square with Heterozygotes Table
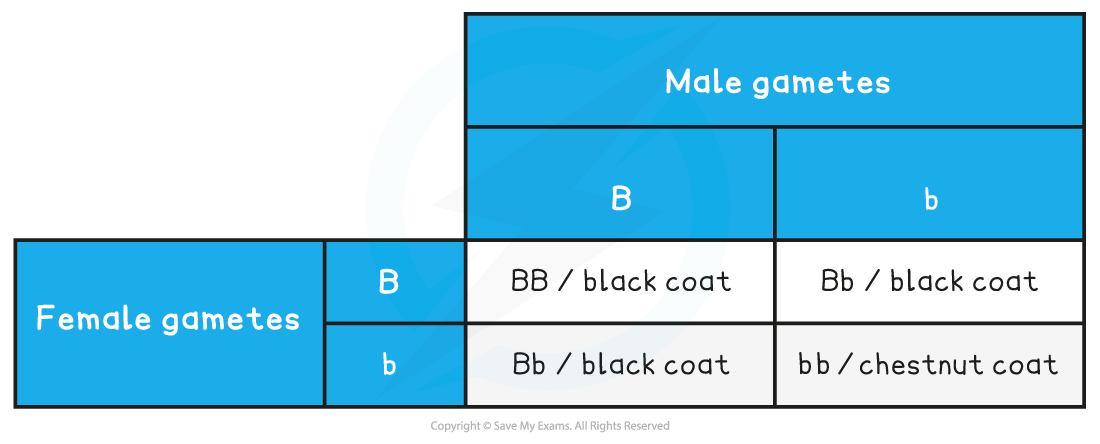
- The forecasted ratio of phenotypes in the offspring – 3 black coats: 1 chestnut coat
- The forecasted ratio of genotypes in the offspring – 1BB : 2Bb : 1bb
Codominance
We can construct the genetic diagrams in the same way, if we are working with codominant alleles. However, in this case, we should represent the genotypes using the capital letter for the gene and use superscript letters for the alleles. For instance, IAIA. The predicted ratios will be different in this case because there will be more possible phenotypes.
Solved Example of Codominance
- A gene for blood type has the following three alleles
- A dominant allele ‘A’ produces blood type A
- A dominant allele ‘B’ produces blood type B
- A dominant allele ‘O’ produces blood type O
In the above example, a person having a blood type A crosses with a person having a blood type B.
- The gene for blood type has three alleles:
- A, a dominant allele produces blood type A
- B, a dominant allele produces blood type B
- O, two recessive alleles will produce blood type O
- In this example, a blood type A person is crossed with a blood type B person
Parental phenotype: Blood type A x Blood type B
Parental genotype: IAIO IBIO
Parental gametes: IA or IO IB or IO
Monohybrid Punnett Square with Codominance Table
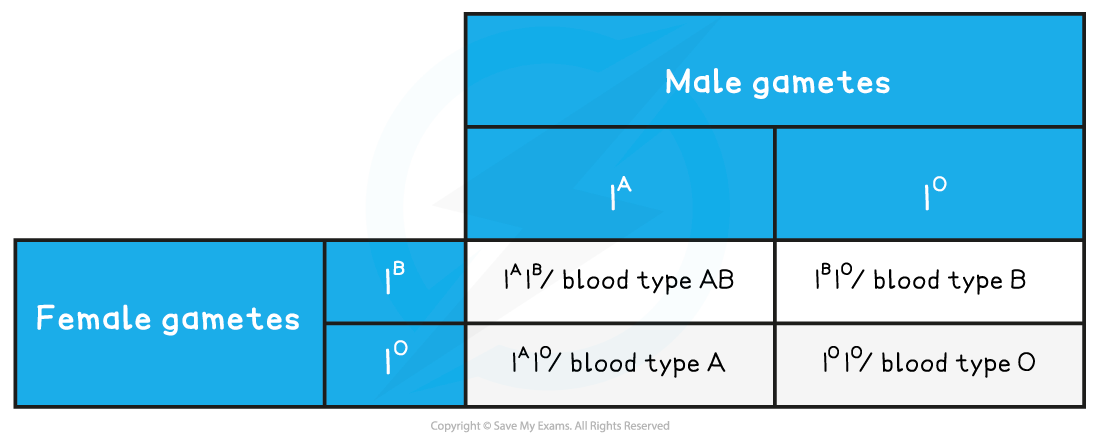
The forecasted ratio of phenotypes in offspring - 1 Blood type AB : 1 Blood type A : 1 Blood type B : 1 Blood type O
The forecasted ratio of genotypes in offspring: 1 IAIB : 1 IAIO : 1 IBIO : 1 IOIO
Sex-Linkage
Sex-linked genes are found only on a single-sex chromosome and not the other which implies that the sex of the individual influences the type of allele they transfer to their offspring through their gametes. The gene on the X chromosome males (XY) will have a single copy of the gene only. On the other hand, the females (XX) will have two.
Females have three phenotypes:
- Normal
- Carrier
- Has the disease
On the other hand, the male has two phenotypes only:
- Normal
- Has the disease
Solved Example of Sex-linked Genes
A popular sex-linked disease is Haemophilia. A gene is present on the X chromosome that encodes for a protein known as factor VIII which is required in making the blood clot. For factor VIII, there are two alleles:
- The dominant F allele which encodes for normal factor VIII
- The recessive f allele which results in absence of factor VIII
If a person has the recessive “f” allele only, then they are unable to produce factor VIII. As a result, their blood does not clot normally due to the absence of factor VIII.
The following genetic diagram depicts how two parents having normal factor VIII can produce offspring with Haemophilia.
Parental phenotypes: carrier female x normal male
Parental genotypes: XFXf XFY
Parental gametes: XF or Xf XF or Y
Monohybrid Punnett square with sex-linkage Table
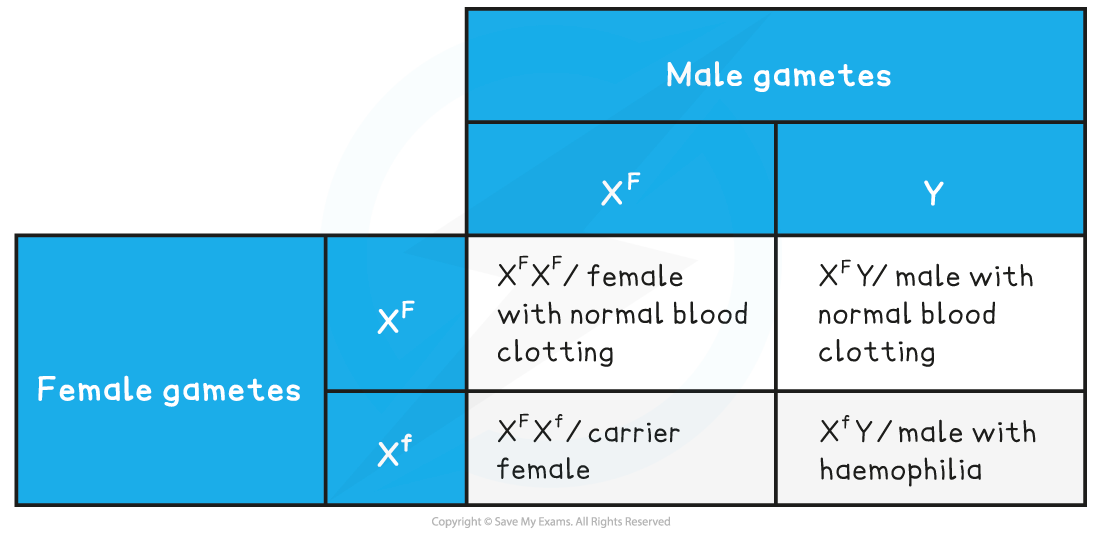
The forecasted ratio of phenotypes in child- 1 female with normal blood clotting: 1 carrier female: 1 male with haemophilia: 1 male with normal blood clotting
Forecasted ratio of genotypes in offspring: 1 XFXF : 1 XFXf : 1 XFY : 1 XfY
Predicting Inheritance Using Dihybrid Crosses
Monohybrid crosses tell us how the alleles from one gene pass over across generations. On the other hand, dihybrid crosses tell us how the alleles of two genes are passed over across generations. Both crosses have quite similar genetic diagrams.
While writing various genotypes, write two alleles for one gene and after that two alleles for the other gene immediately. Make sure that you do not mix up the alleles from different genes.
Solved Example: Dihybrid genetic diagram
Horses possess one gene for coat colour that has the following two alleles:
- A dominant allele ‘B’ that produces a black coat
- A recessive allele ‘b’ that produces a chestnut coat
For eye colour, horses have one gene that has the following two alleles:
- A dominant allele ‘E’ that produces brown eyes
- A recessive allele ‘e’ that produces blue eyes
In the above example, a horse that is heterozygous for both genes crosses over a horse that is heterozygous for one gene and homozygous for another.
Parental phenotypes: black coat, brown eyes x chestnut coat, brown eyes
Parental genotypes: BbEe bbEe
Parental gametes: BE/Be/bE/be bE/ be
Dihybrid Cross Punnett Square Table
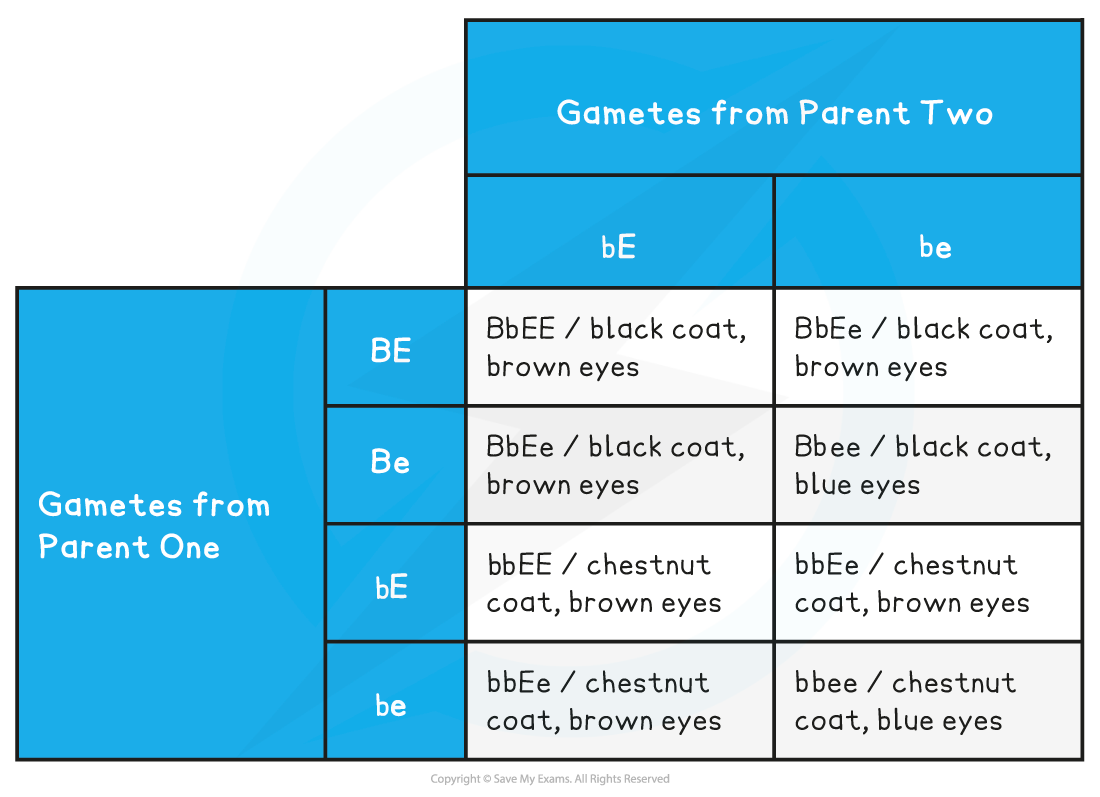
The forecasted ratio of phenotypes in the child – 3 black coat, brown eyes : 3 chestnut coat, brown eyes: 1 black coat, blue eyes: 1 chestnut coat, blue eyes
Autosomal Linkage
Dihybrid crosses and their predictions depend on the assumption that the genes under observation behave independently of each other during meiosis. Remember that not all genes behave independently during meiosis as some genes that are present on the same chromosome show autosomal linkage and stay together in the original parental combination.
The linkage between the genes affects how parental alleles are transferred to the offspring through gametes. While writing linked genotypes, one should keep the linked alleles within a bracket.
For instance, if an individual has a genotype FFGG, but there is a linkage between the two genes, then we can write it as (FG)(FG).
An Example Explaining Autosomal Linkage
There is an autosomal linkage between the genes for tail length and scale colour in a species of newt. The gene for tail length has the following two alleles :
-
- A Dominant allele T that produces a tail of normal length
- A Recessive allele t that produces a tail of shorter length
The gene for scale colour has the following two alleles:
-
- Dominant allele G produces green scales
- Recessive allele g that produces white scales
A heterozygous newt having a normal tail length and green scales crosses with a newt that has a shorter tail length and white scales
Parental phenotypes: normal tail, green scales x short tail, white scales
Parental genotypes: (TG)(tg) (tg)(tg)
Parental gametes: (TG) or (tg) (tg)
Dihybrid Cross with Linkage Punnett Square Table
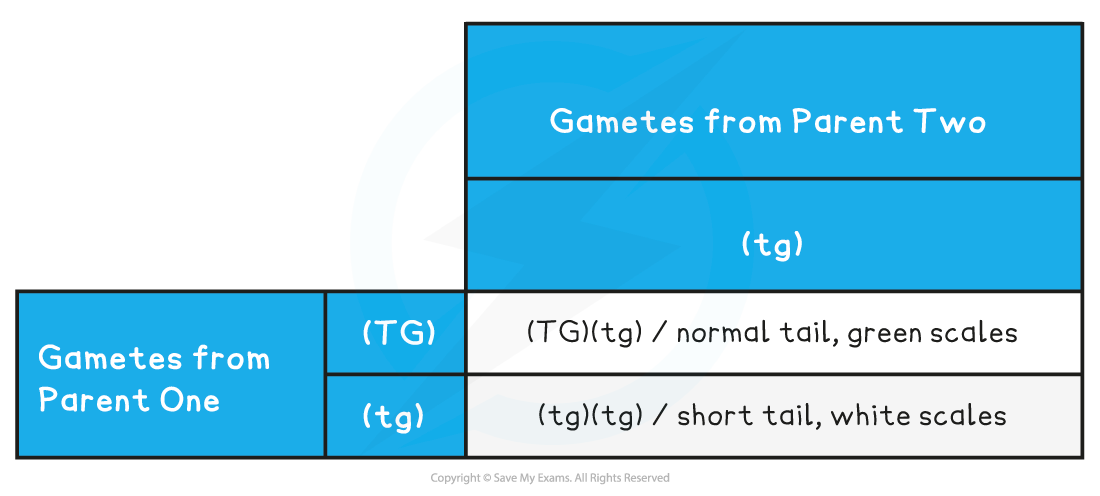
The forecasted ratio of phenotypes in child – 1 normal tail, green scales : 1 short tail, white scales
Forecasted ratio of genotypes in child – 1 (TG)(tg) : 1 (tg)(tg)
Epistasis
There is a probability that one gene influences the expression of another gene. Epistasis refers to two genes of different chromosomes affecting the same feature. Epistasis, if present, should be considered while determining the phenotypes of individuals. The phenotype is determined by the entire combination of alleles from different genes.
Solved Example Explaining Epistasis
A gene dictates the feather colour of pigeons and has two alleles (R/r)
-
- Allele R encodes for a pigment that produces grey feathers in pigeons
- Allele r doesn’t produce a pigment and results in white feathers
There is another gene that has an effect on feather colour and has two alleles (F / f) :
-
- The dominant allele F prevents grey feathers from being produced even in the presence of allele R
The possible phenotypes are:
- RRFF, rrFF, RrFF, RRFf, RrFf, rrFf, and rrff produce white feathers.
- RRff and Rrff produce grey feathers.
Summarise with AI:
Did you like this article? Rate it!


