In this article, we will interpret and construct genetic diagrams, including Punnett squares, to explain and predict the results of test crosses. We will also employ the chi-squared test to test the importance of differences between observed and expected results. So, let us get started.


Using Test Crosses to Predict Inheritance
- We can employ a test cross to deduce the genotype of an unknown individual that expresses a dominant phenotype.
- The individual under consideration is crossed with an individual that depicts a recessive phenotype.
- This is because the individual having a recessive phenotype has a genotype that is known.
- As a result, the phenotypes of the offspring offer enough information to suggest the genotype of an unknown individual.
Outcomes of Monohybrid and Dihybrid Test Cross
In this section, we will discuss the outcomes of a monohybrid and dihybrid test cross.
The outcome of a Monohybrid Test Cross
- If no offspring shows the recessive phenotype, then the homozygous dominant is the unknown genotype.
- If at least one of the offspring expresses the recessive phenotype, then the heterozygous dominant is the unknown genotype
The outcome of a Dihybrid Test Cross
- In case, no offspring expresses the recessive phenotype for either gene, then the homozygous dominant for both genes is the unknown genotype
- If a minimum of one offspring expresses the recessive phenotype for one gene, but not for the other, then the unknown genotype is heterozygous for one gene, whereas homozygous dominant for the other
- If a minimum of one offspring expresses the recessive phenotype for both genes, then the unknown genotype is heterozygous for both the genes
Solved Example of Test Crosses
Rabbits contain one gene for ear length and have the following two alleles:
- A dominant allele, expressed by the letter “D”, that produces long ears
- A recessive allele, expressed by a small case letter “d”, that produces shorter ears
Suppose a breeder has a rabbit named Snowball that possesses long ears. The breeder wants to determine the genotype of the rabbit. The possibilities are two:
- either the rabbit has genotype DD
- or the rabbit has genotype Dd
Consider another situation in which the breeder crosses the long-eared rabbit with a short-eared one. It means that the rabbit depicting the short ear recessive phenotype must have the genotype dd.
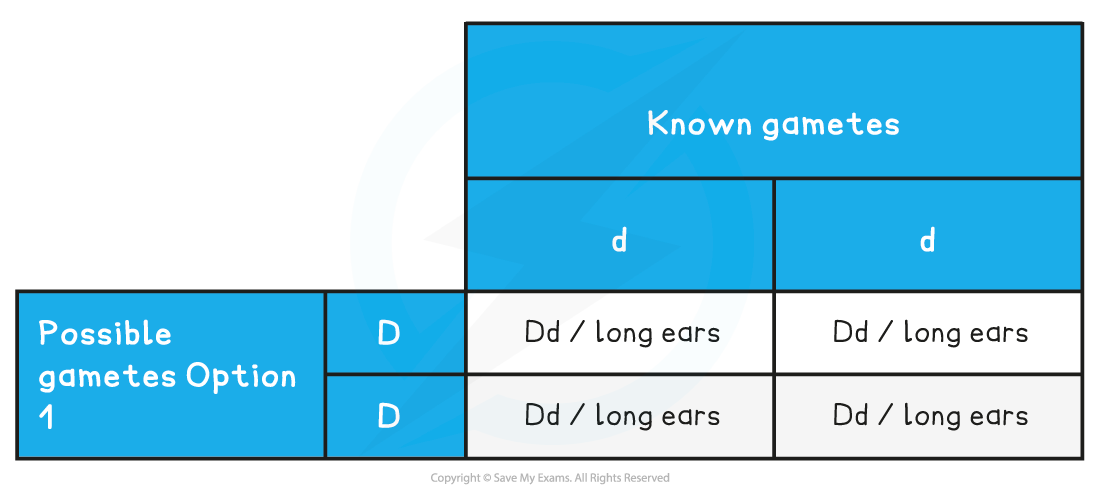
For possibility 1, the test cross table is shown below:
The forecasted ratio of phenotypes of offspring – 1 long ear
The forecasted ratio of genotypes of offspring – 1 Dd
For possibility 2, the test cross table is given below:
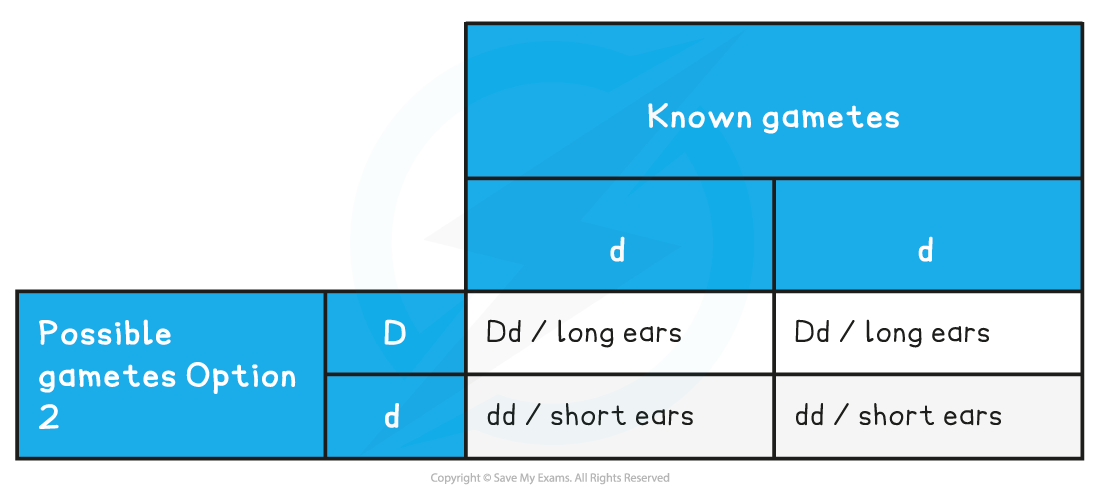
The forecasted ratio of phenotypes of offspring – 1 long ear: 1 short ear
The predicted ratio of genotypes of offspring – 1 Dd: 1 dd
The breeder detects varying phenotypes present in the offspring. There is a minimum of one offspring that has a short ear phenotype. From this, the breeder gets to know that the genotype of the rabbit Snowball is Dd.
If the genotype of the rabbit Snowball is DD, then no offspring will have short ears.
In the next section of the article, we will discuss how to predict inheritance using the Chi-squared test.
Using Chi-squared Test to Predict Inheritance
- There can be small or big differences between the expected and observed results in the experiments.
- In case, there is a major statistical difference between the results, then it indicates that something that happened in the experiment was overlooked. For instance, the linkage between the genes.
- A statistical test, known as the chi-squared test, tells whether there is a major difference between the observed and expected results in an experiment or not.
- This test is completed only when the data is categorical which means that it can be grouped.
How to Compute Chi-squared Values?
- First of all, get the observed and expected results for the experiment
- Compute the difference between each set of results
- Square each difference. (Squaring makes it irrelevant whether the difference is positive or negative because the negative difference will eventually become positive after squaring)
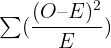
- As a next step of the process, divide each squared difference by the expected value and obtain a sum of these answers to get the chi-squared value

 = sum of
O = observed value
E = expected value
How to Analyse Chi-squared Values?
- To determine what the chi-squared value indicates, we use a table that relates chi-squared values to probabilities that are used
- If a larger probability is represented by a chi-squared value as compared to the critical probability, then we can say that the differences between the expected and observed results are because of the chance
- If a smaller probability is represented by it as compared to the critical probability, then there are significant differences in the results and something that is overlooked may be the cause of these differences
- To know the critical probability, biologists typically employ a probability of 0.05 which means that because of the chance, five out of 100 experiments will be different)
- One should also consider the number of comparisons made when determining the critical probability. This is referred to as degrees of freedom.
Solved Example – Chi-squared Test
An experiment was conducted to determine the inheritance of two genes in rabbits. One gene was for coat colour and the other was for the length of the ear.

A dihybrid cross was constructed which reflected that the forecasted ratio of phenotypes is 9 : 3 : 3: 1. The phenotypes of the offspring were recorded after many rabbits were bred together. The ratio of the offspring differs from what was expected earlier. Therefore, a chi-squared test was used to know if it occurred due to chance or some other reason.
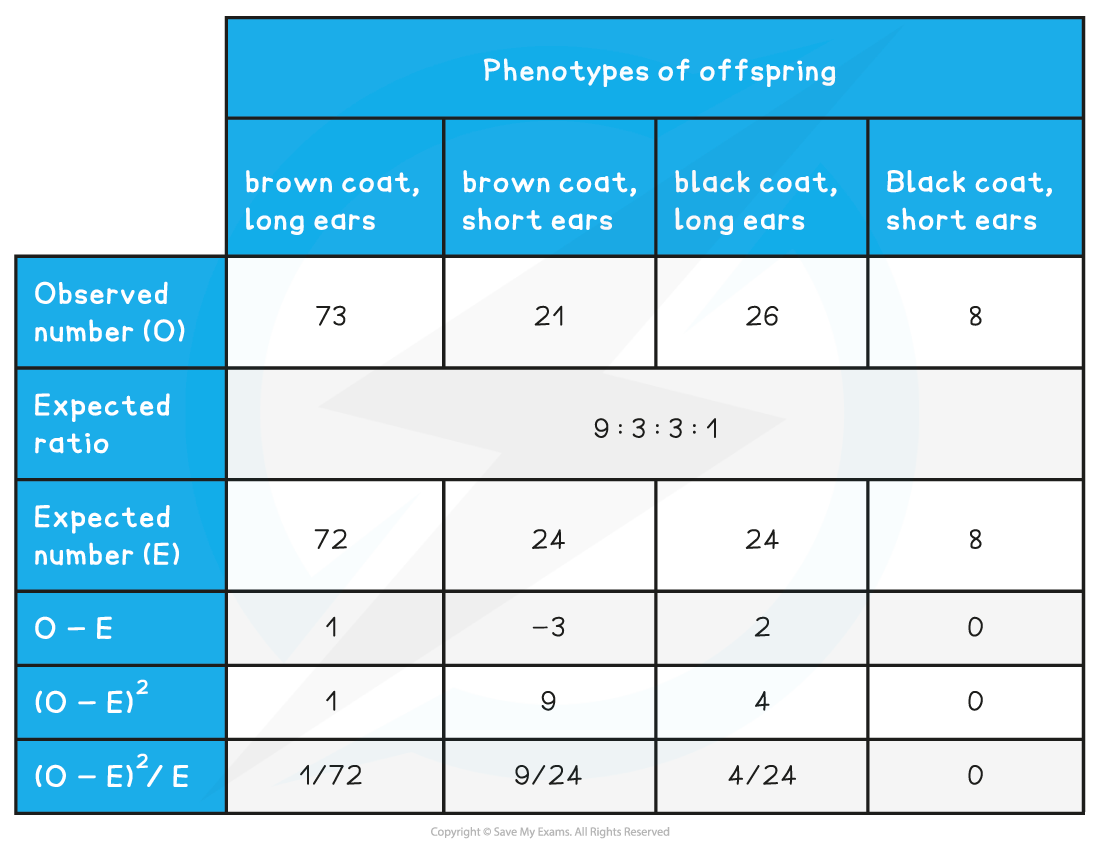
We will compute the expected ratio by multiplying the total number of organisms, i.e. 128 rabbits with each of the expected ratios below:
( or
or  or or
or or  )
)
 or 0.56

To comprehend the value of this chi-squared test 0.56, a table is required which will relate chi-squared values to probability.
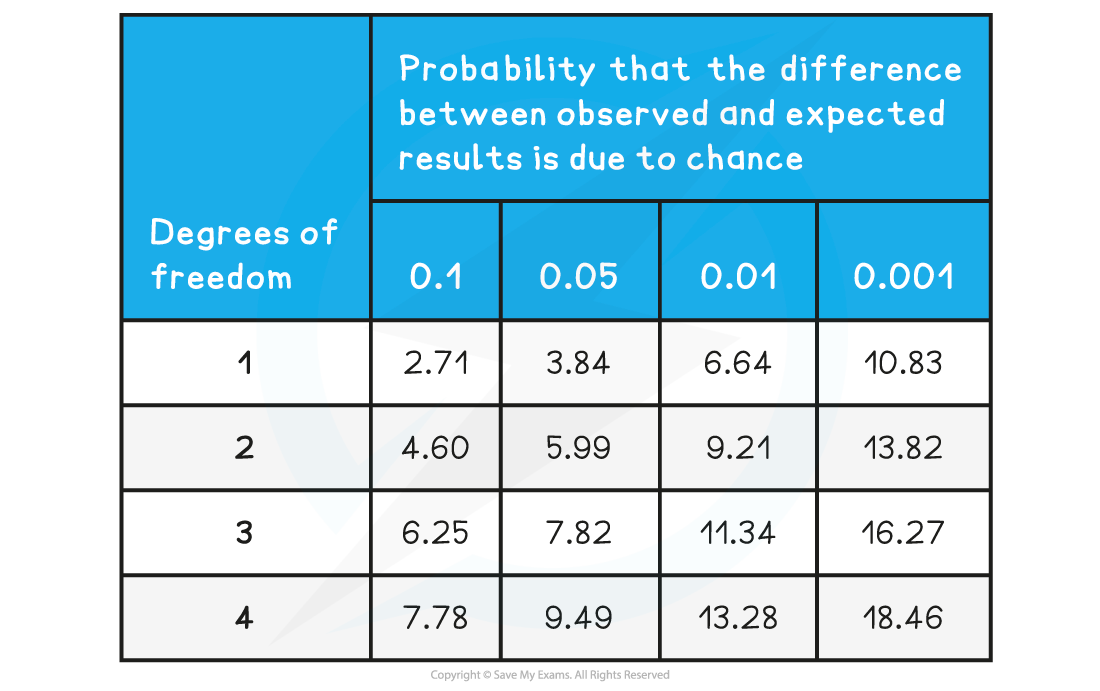
- The chi-squared table depicts the probability that the difference between the expected and observed values is because of the chance
- The degrees of freedom can be computed from the results. It is worked out by subtracting one from the number of classes. For instance, in the example above, there are four phenotypes which implies that there are four classes. So, 4 – 1 = 3.
- It implies that the values present in the third row are critical for comparison. In this experiment, there is a critical probability of 0.05 which means that the value of 7.82 is considered for comparison.
- 56 will be present somewhere on the left-hand side of the table which represents the probability that is quite greater than 0.1.
- It implies that there is no major difference between the expected and observed results and any differences which were present only occurred because of chance.
Summarise with AI:
Did you like this article? Rate it!


