A graph is a visual representation of the relationship between independent and dependent variables plotted on a coordinate grid. By mapping algebraic inputs (x) to outputs (y), graphs translate abstract equations into geometric curves and lines, revealing rates of change, turning points, intersections, and limits.
The Cartesian Coordinate System & Quadrants
The Cartesian coordinate plane is constructed from two perpendicular number lines: the horizontal x-axis and the vertical y-axis, intersecting at the origin (0, 0).
The axes divide the plane into four distinct regions called quadrants, numbered counter-clockwise starting from the top-right:
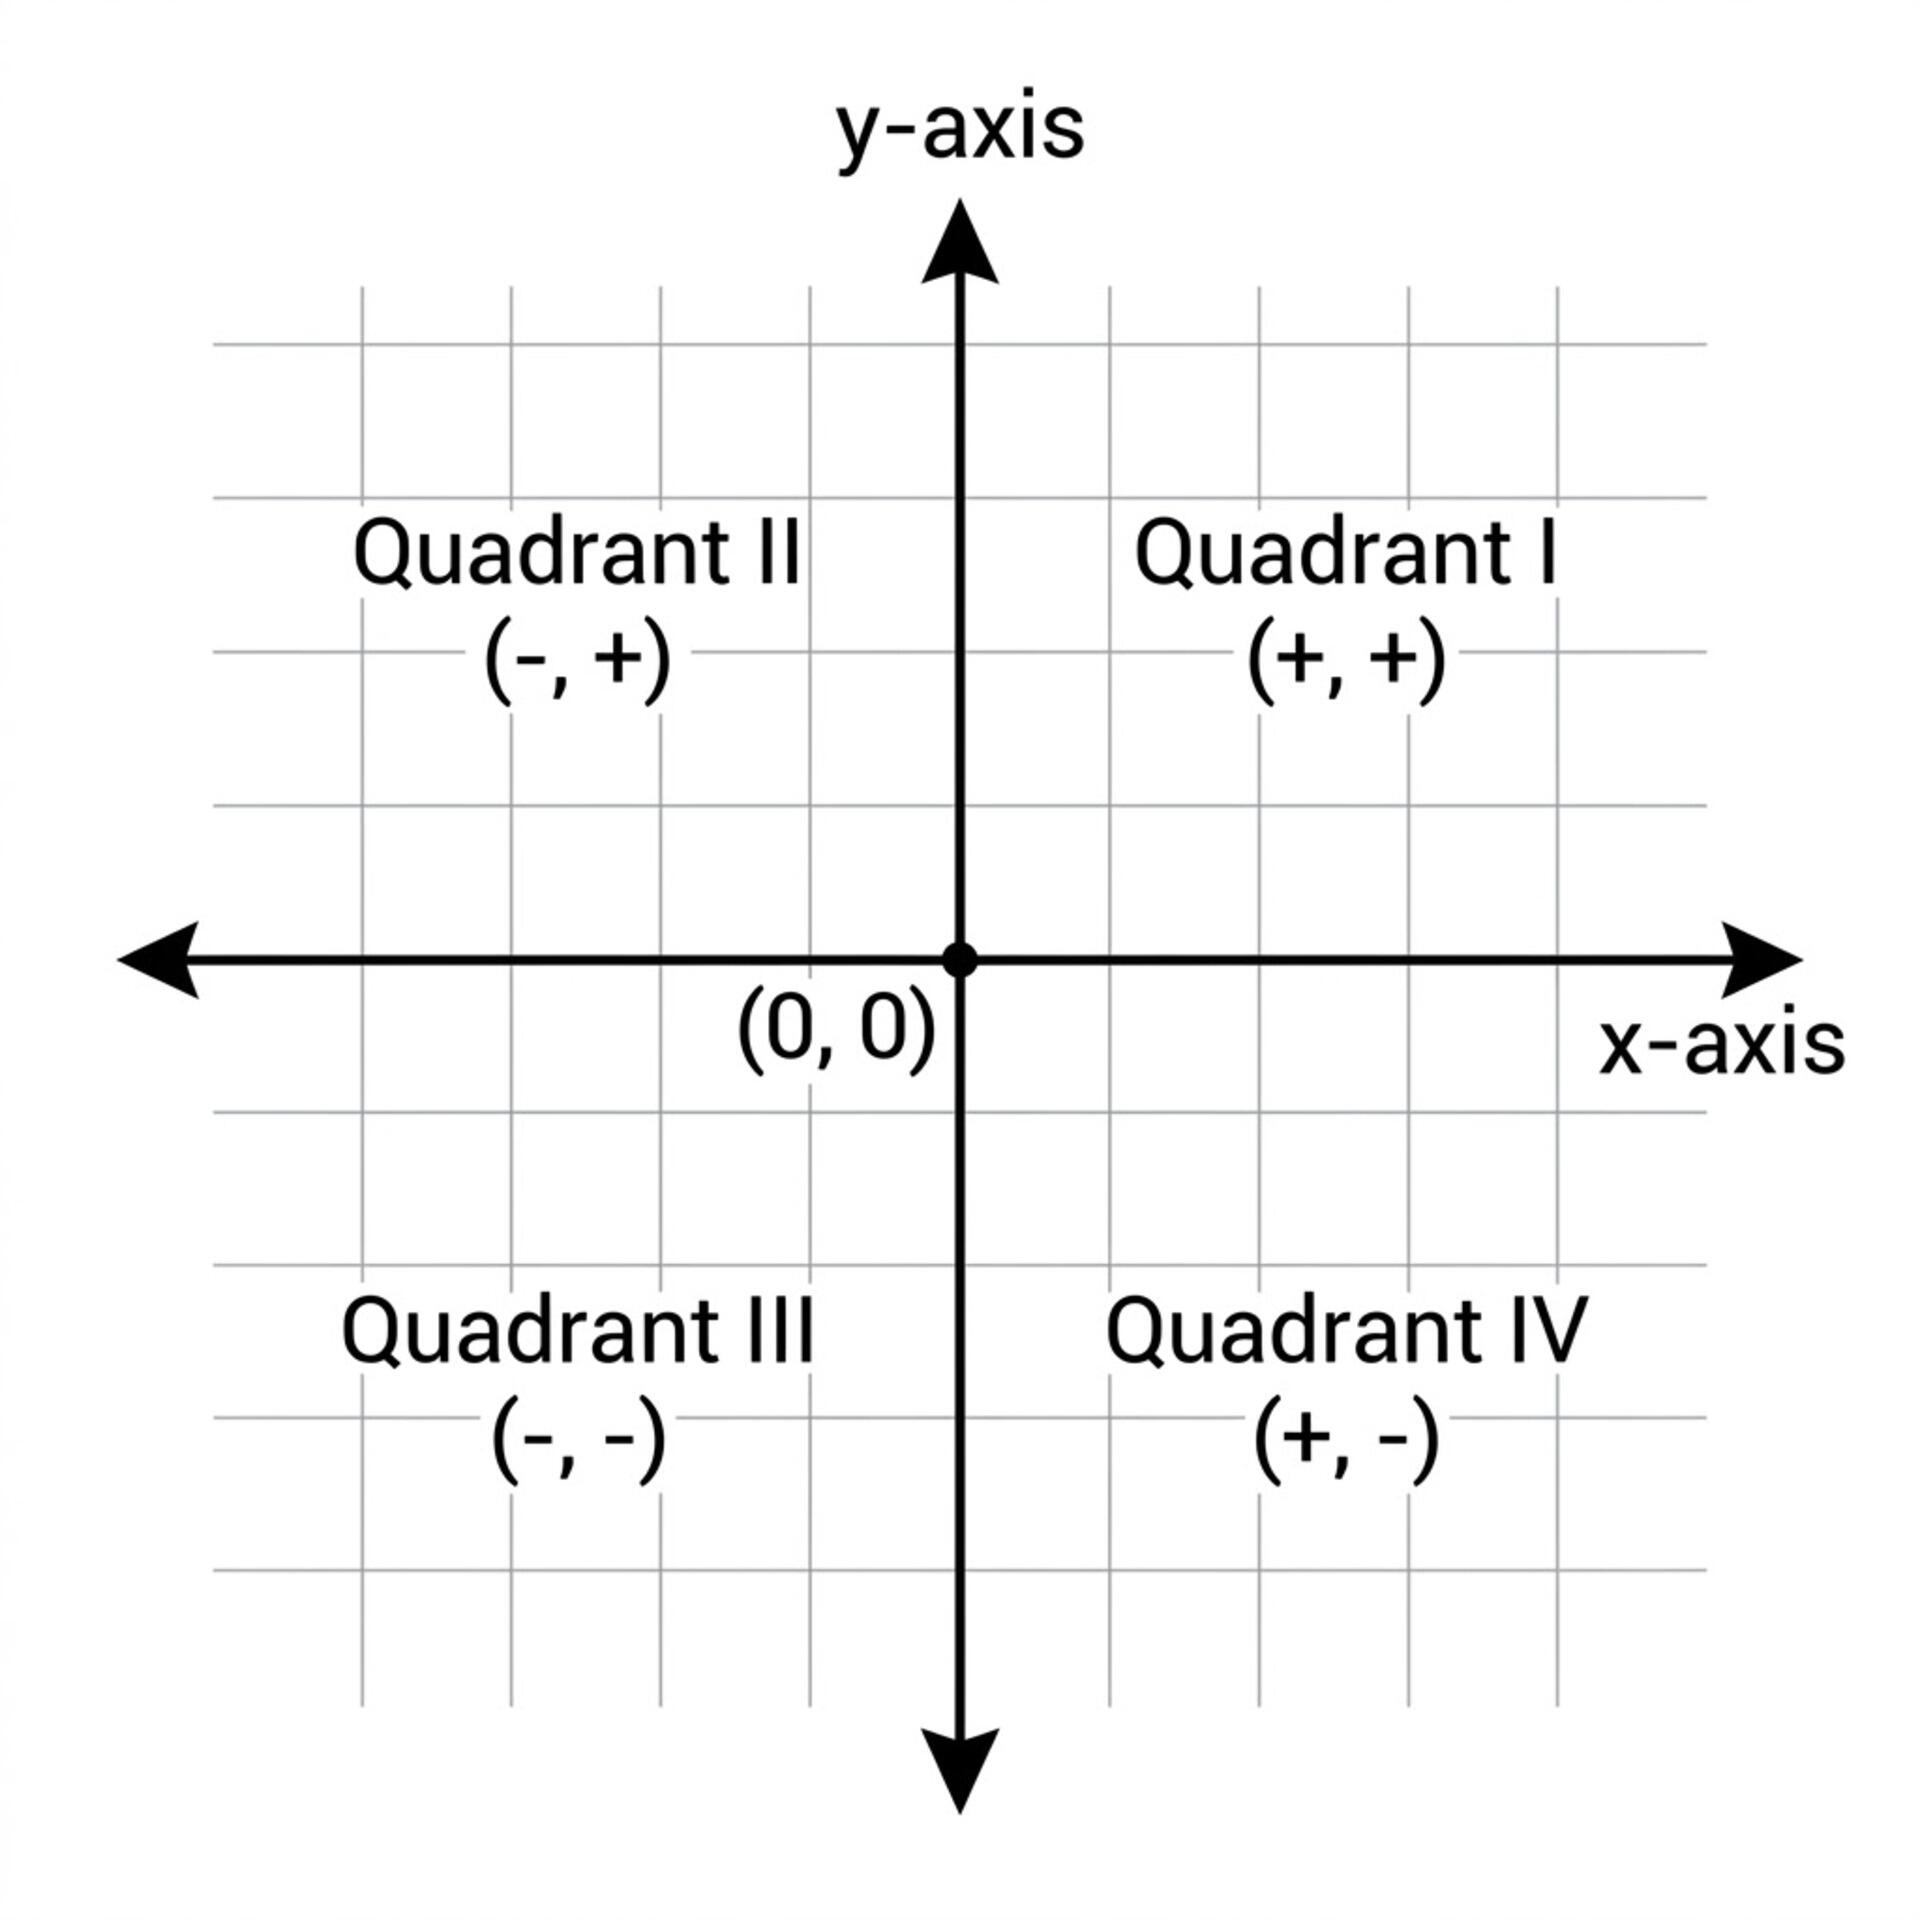
Quadrant I: x > 0, y > 0 (both coordinates positive)
Quadrant II: x < 0, y > 0 (x negative, y positive)
Quadrant III: x < 0, y < 0 (both coordinates negative)
Quadrant IV: x > 0,\; y < 0 (x positive, y negative)


Linear Graphs (y = mx + c)
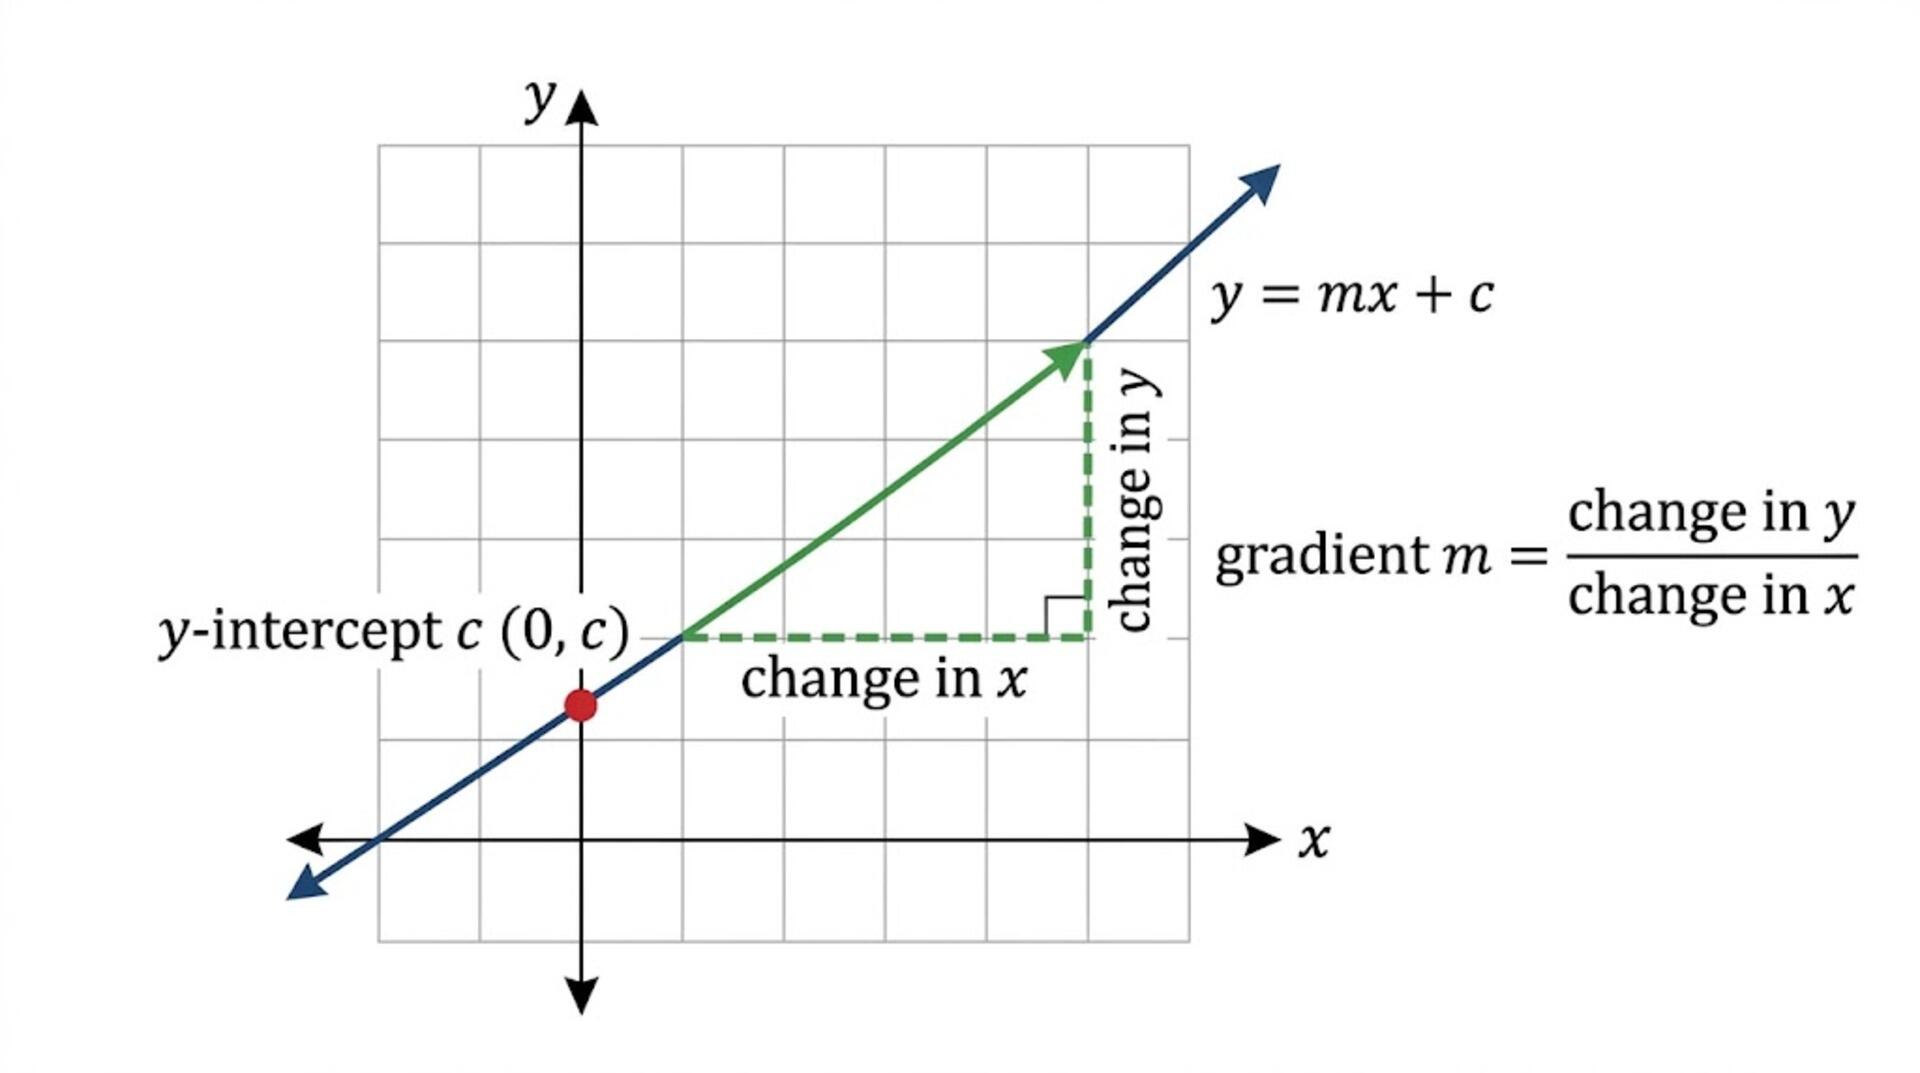
A linear function produces a straight-line graph representing a constant rate of change between x and y.
The standard slope-intercept form used in UK specifications is:
- m represents the gradient (slope):
- If m > 0, the line rises from left to right.
- If m < 0, the line falls from left to right.
- If m = 0, the line is horizontal (y = c).
- crepresents the y-intercept: The point (0, c) where the line crosses the y-axis (x = 0).
- The x-intercept: The point where the line crosses the x-axis (y = 0), found by setting y = 0:
Parallel and Perpendicular Lines:
- Two lines are parallel if their gradients are equal:
- Two lines are perpendicular if their gradients are negative reciprocals:
Quadratic Graphs & Parabolas
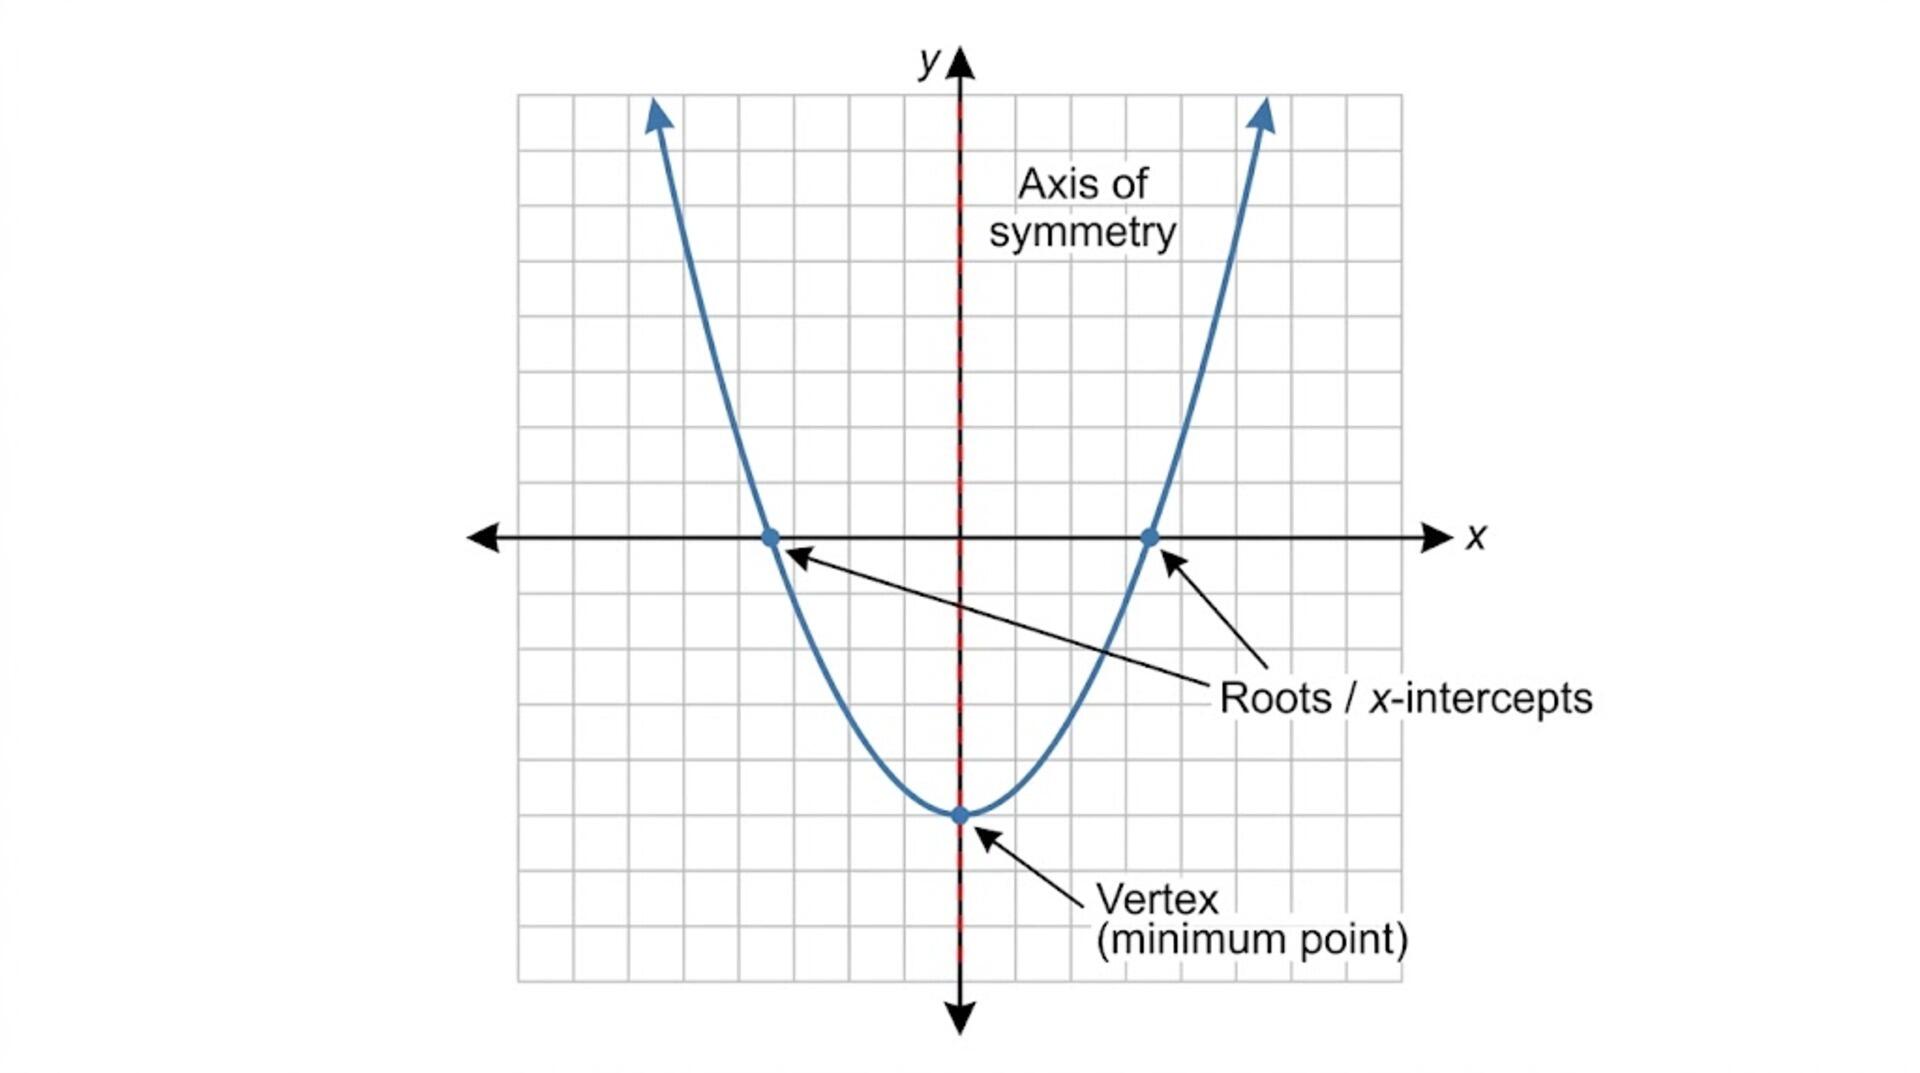
A quadratic function is a polynomial of degree two. Its graphical representation is a symmetric U-shaped curve known as a parabola.
The general standard form is:
- If a > 0, the parabola opens upwards (), possessing a minimum turning point.
- If a < 0, the parabola opens downwards (), possessing a maximum turning point.
- The constant c is the y-intercept at (0, c).
The Vertex Form
To locate the turning point (vertex) and the axis of symmetry directly, express the quadratic in vertex form:
- Vertex: (h, k)
- Axis of Symmetry: The vertical line x = h
You can convert from standard form to vertex form by completing the square or by using the vertex coordinate formulas:
Cubic Graphs
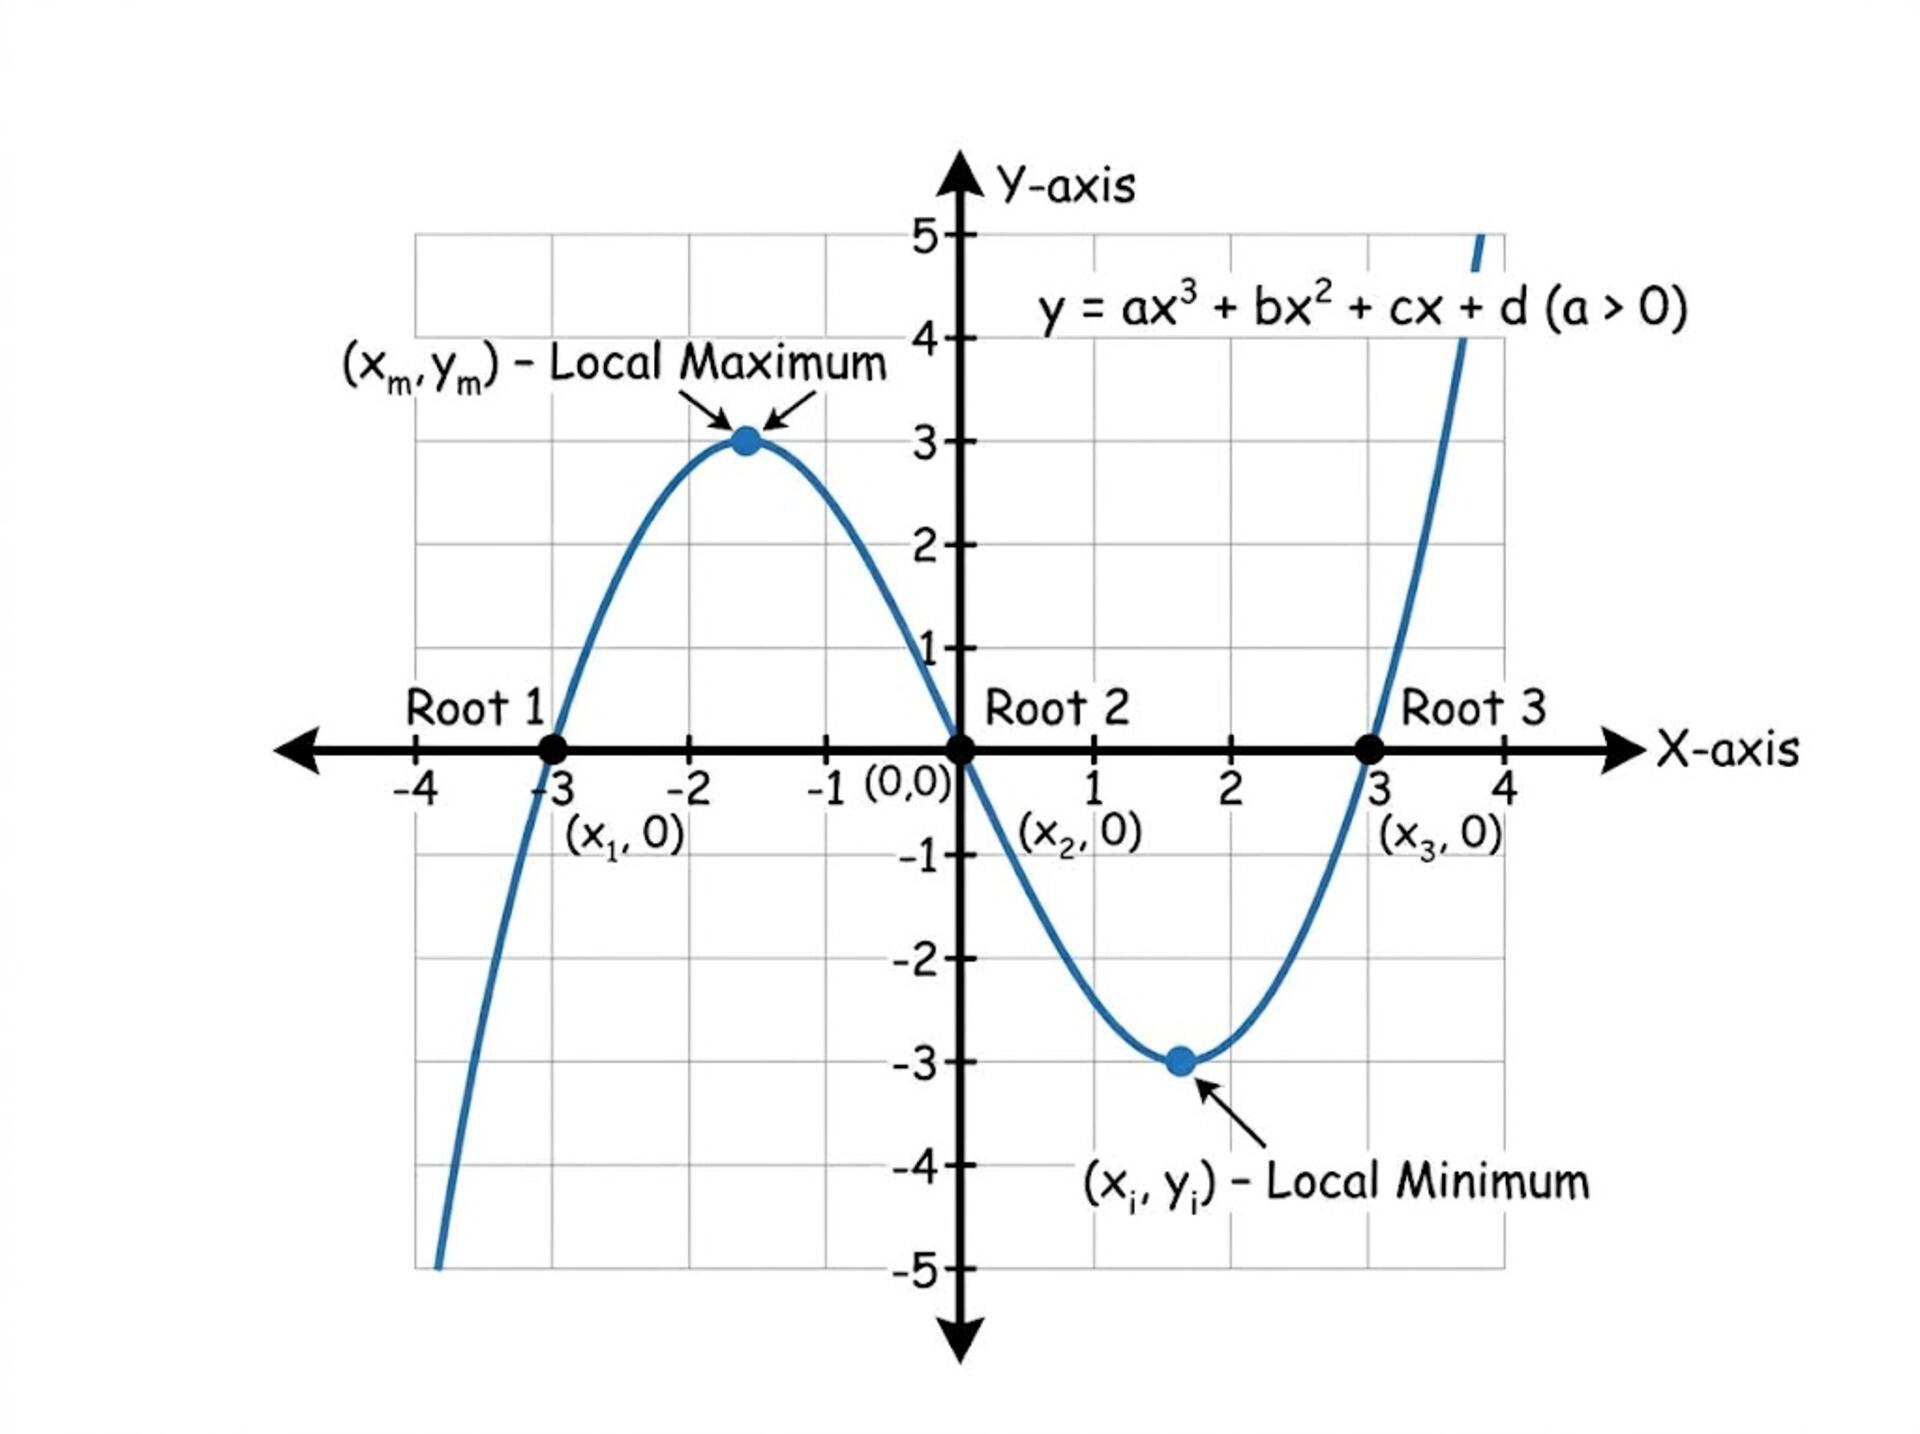
A cubic function is a polynomial of degree three:
Structural Properties:
- End Behaviour:
- When a > 0: As , and as . The curve begins in Quadrant III and finishes in Quadrant I.
- When a < 0: As , and as . The curve begins in Quadrant II and finishes in Quadrant IV.
- Roots: A cubic function must cross the x-axis at least once, and can have up to three real roots.
- Turning Points: A cubic can have either two turning points (one local maximum and one local minimum) or no turning points (a monotonic curve that may feature a point of inflection).
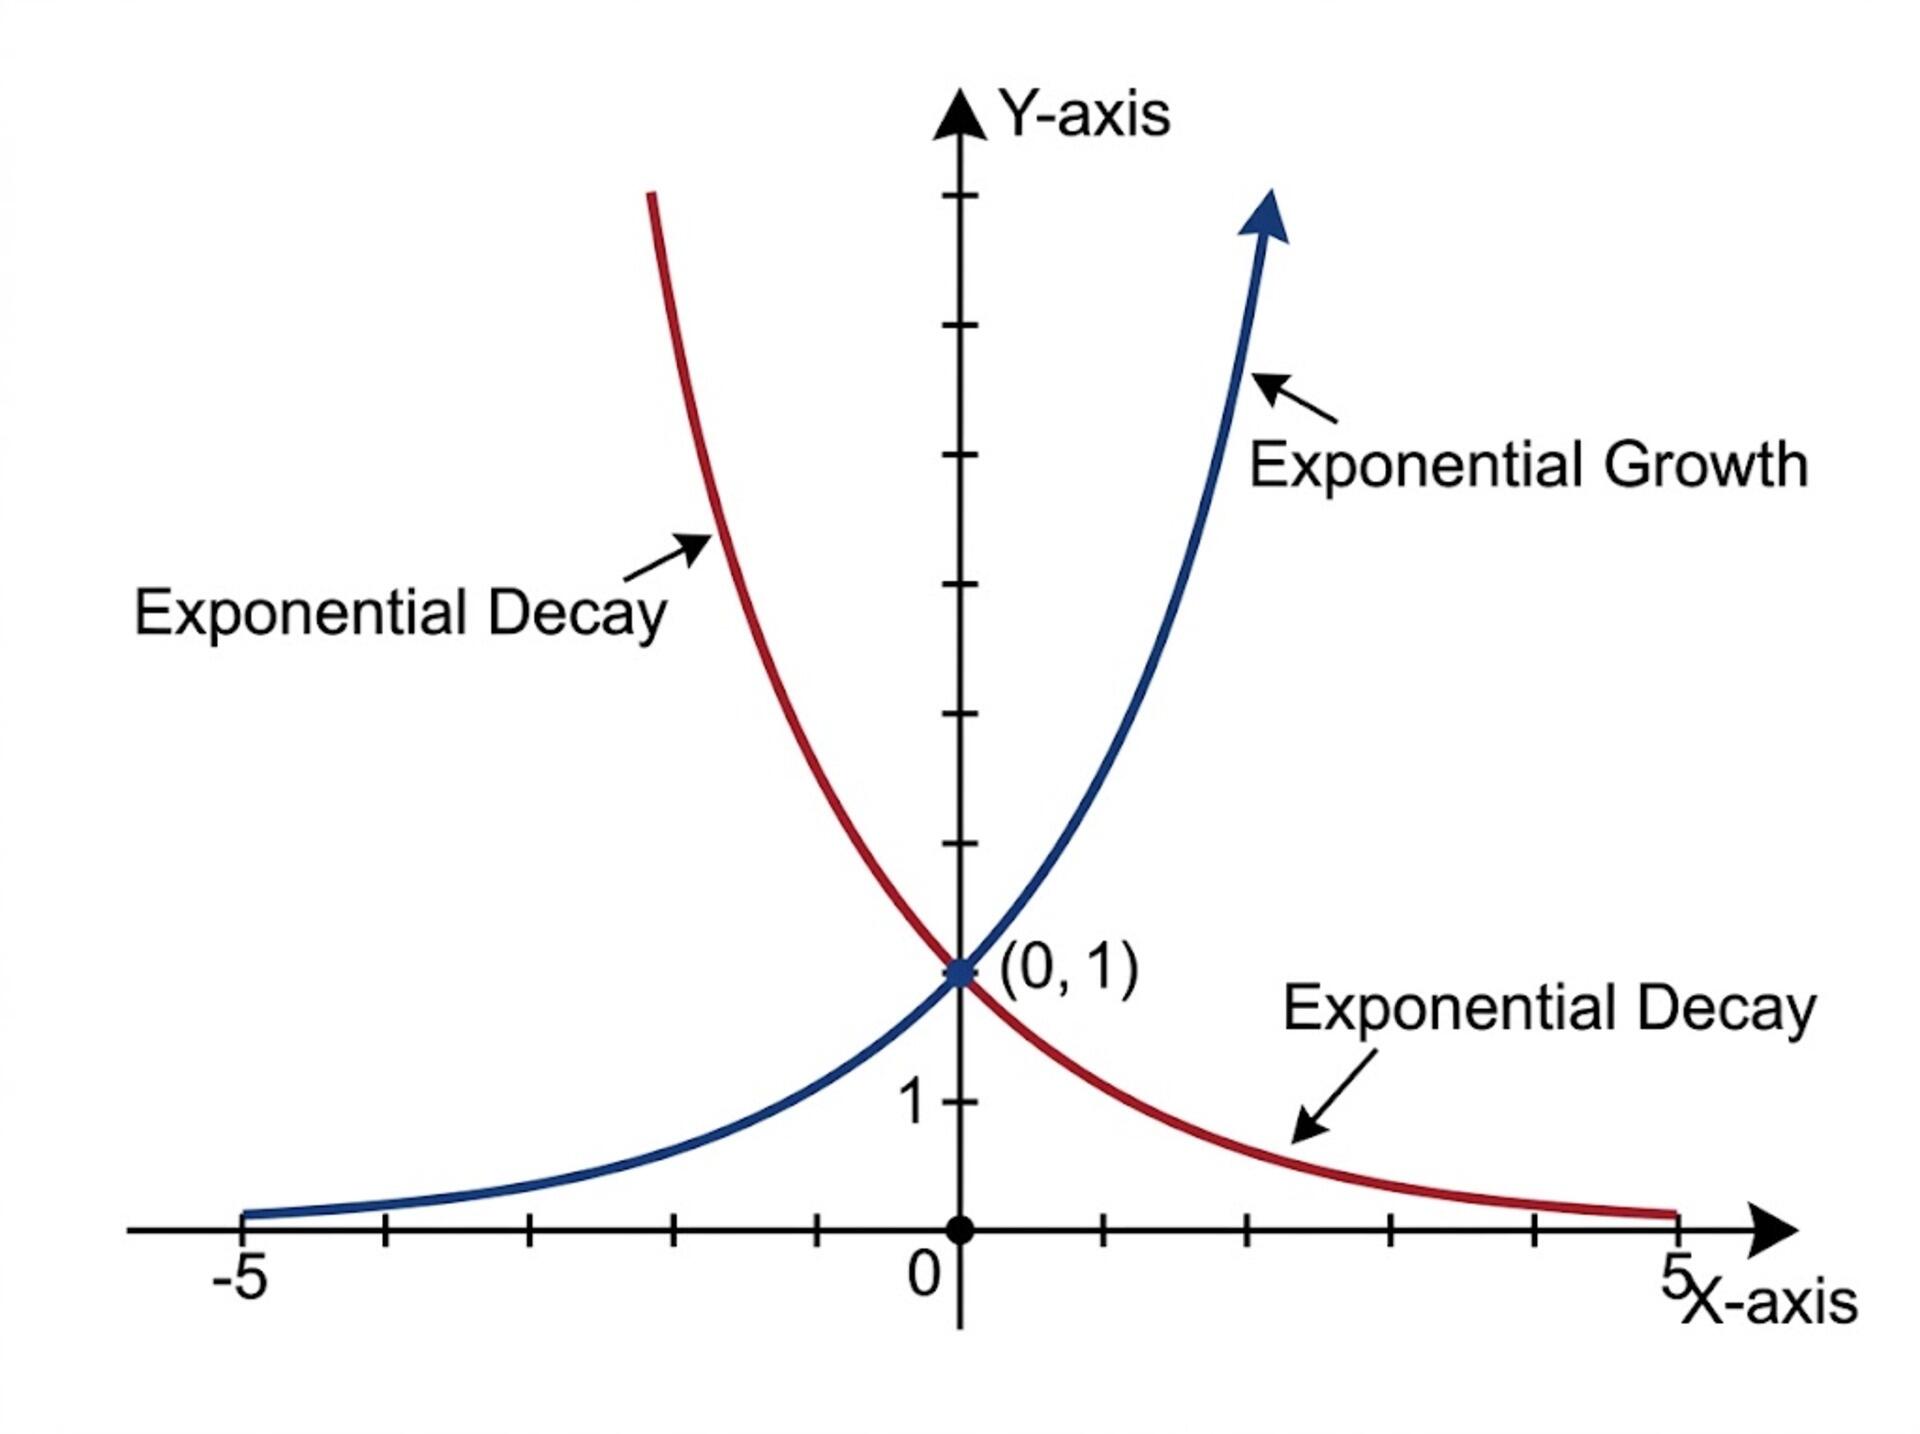
Exponential Graphs
An exponential function has the variable in the exponent:
- Exponential Growth (b > 1): As x increases, y increases at an accelerating rate.
- Exponential Decay (0 < b < 1): As x increases, ydecreases towards zero.
Key Features:
- y-intercept: Always at (0, a) because
- Horizontal Asymptote: For , the line y = 0 (x-axis) is a horizontal asymptote. The curve approaches this line arbitrarily closely but never touches or crosses it.
Practice Questions & Solutions
Points A and B have coordinates (2, 9) and (8, 1) respectively.
(a) Calculate the gradient of the line segment AB.
(b) Find the coordinates of the midpoint of AB.
(c) Determine the equation of the perpendicular bisector of AB in the form ax + by + c = 0, where a, b, c 
(a) Gradient of AB:

(b) Midpoint M:

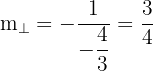
(c) The perpendicular gradient is the negative reciprocal of  :
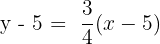
Using point-slope form with midpoint (5, 5):
Multiply through by 4:


Rearrange into the form ax + by + c = 0:
3x - 4y + 5 = 0
A curve has equation

(a) Express f(x) in the form
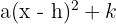
(b) Write down the coordinates of the vertex and state the line of symmetry.
(c) State the range of the function f(x) for

(a) Complete the square for





(b) The vertex is at (3, -8)
The axis of symmetry is the vertical line:
x = 3
(c) Because a = 2 > 0, the parabola opens upwards and has a minimum value at the vertex y = -8.

The function h(x) is defined by

for
(a) State the equation of the horizontal asymptote of y = h(x).
(b) Calculate the exact coordinates of the y-intercept.
(c) Determine the exact x-intercept in terms of natural logarithms.
(a) Complete the square for
(b) The vertex is at (3, -8).
The axis of symmetry is the vertical line:
x = 3
(c) Because a = 2 > 0, the parabola opens upwards and has a minimum value at the vertex y = -8.
Summarise with AI:
Did you like this article? Rate it!

 Loading...
I get it somehow, there are others who are unfamiliar and I have a hard time with it but it’s okay that I get it.
Thanks for sharing your thoughts! It’s completely normal to find some parts unfamiliar or more difficult than others. The important thing is that you’re making progress and understanding more as you practise. Keep going! 😊
At least I understood some of it, but there are others that I’m confused about and have a hard time understanding, but I get it.
Thanks for sharing! It’s great that you’ve understood some of it already. Don’t worry if a few parts are still confusing — keep practising and take your time with the trickier sections. You’ll get there! 😊
The lesson was a little difficult for me, especially the word problems, but the examples helped me understand it better.
Thanks for your feedback! Word problems can definitely be tricky, so we’re glad the examples helped make the lesson clearer. Keep practising — it gets easier with time! 😊
Thankyouuu po