In mathematics, optimisation is the process of finding the greatest possible value (a maximum) or the smallest possible value (a minimum) of a quantity subject to specific real-world constraints. Whether designing a container to hold the greatest volume using minimal material, or setting prices to maximise business profit, optimisation translates descriptive word problems into algebraic functions and uses calculus to identify optimal outcomes.
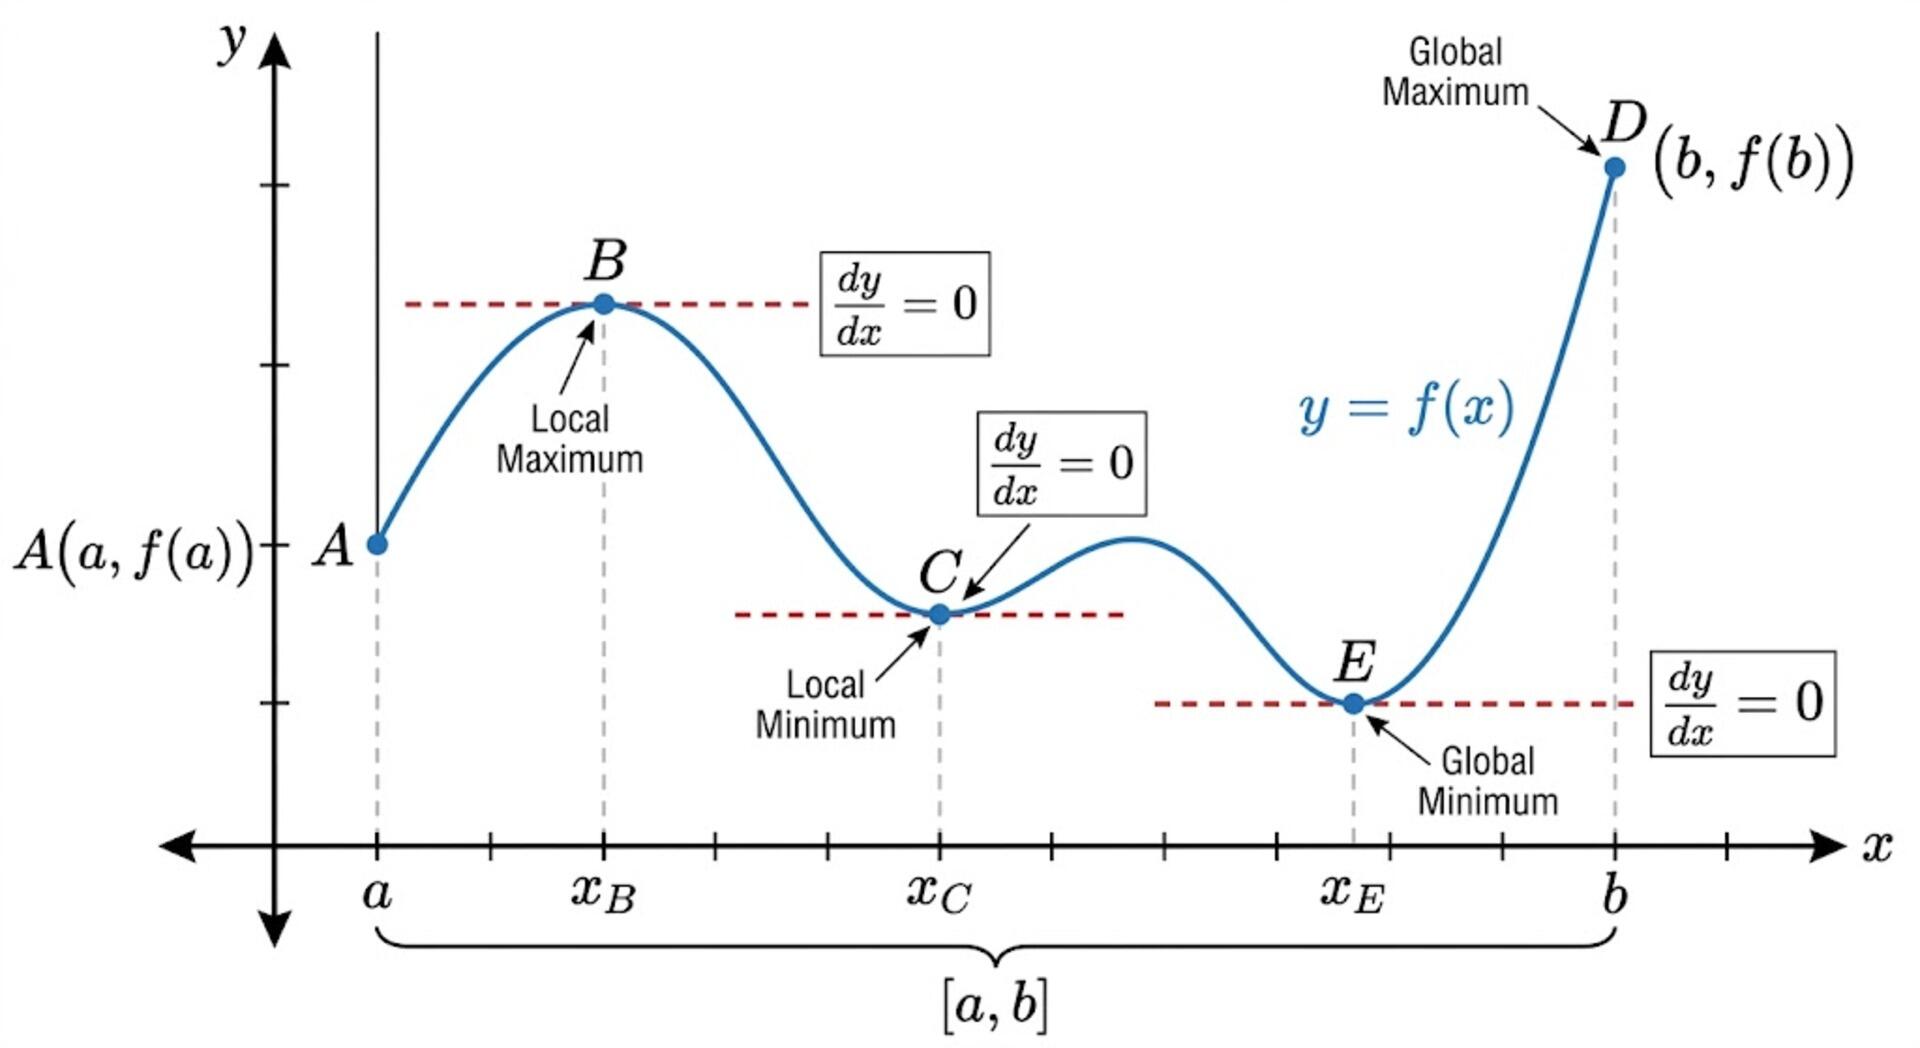
At the core of optimisation is the behaviour of gradients: at the peak or trough of a smooth continuous curve, the rate of change momentarily becomes zero:


Stationary Points and Extrema
A stationary point (or turning point) on a curve y = f(x) occurs where the tangent line is horizontal—meaning the first derivative is zero:
Extrema are classified into two categories:
- Local (Relative) Extrema: A local maximum or minimum is the highest or lowest value of the function within a specific local neighbourhood of x.
- Global (Absolute) Extrema: The highest or lowest value attained by the function across its entire valid domain [a, b]. An absolute extremum can occur either at an internal stationary point or at the boundaries (endpoints) of the domain.
Testing the Nature of Stationary Points
Once an input x = c satisfying f'(c) = 0 is identified, its nature must be verified using either the First Derivative Test or the Second Derivative Test.
The First Derivative Test (Sign Change)
Examine the sign of the gradient immediately before (x < c) and immediately after (x > c) the turning point:
| Gradient Sign Before ( x < c ) | Gradient at Stationary Point (x = c) | Gradient Sign After (x > c) | Nature of Stationary Point |
|---|---|---|---|
| Positive (+) | Zero (0) | Negative (-) | Local Maximum |
| Negative (-) | Zero (0) | Positive (+) | Local Minimum |
| Positive (+) | Zero (0) | Positive (+) | Point of Inflection |
| Negative (-) | Zero (0) | Negative (-) | Point of Inflection |
The Second Derivative Test (Curvature)
The second derivative, , measures the rate of change of the gradient (concavity):
- Local Maximum: (the curve is concave downwards , gradient is decreasing).
- Local Minimum: (the curve is concave upwards , gradient is increasing).
- Inconclusive:. In this case, you must use the First Derivative Test to determine whether the point is a maximum, a minimum, or a point of inflexion.
Practice Questions & Solutions
A landscape gardener has 120m of timber to build a rectangular vegetable patch divided into three equal sections by two internal parallel wooden dividers.
(a) If x is the length of each of the four parallel dividers and y is the total length of the patch, show that the enclosed area is
 .
.
(b) Find the value of x that maximizes the total enclosed area.
(c) Verify that this area is a maximum, and state the maximum area.
The patch has 4 segments of length x (the two outer widths and the two interior dividers) and 2 segments of length y (the two lengths).

The area formula is:

(Note: If the total timber is arranged such that  ,
,  ; if using a perimeter formulation with
  , ).
, ).
Taking the formula directly:
(b)
Differentiate A with respect to x:
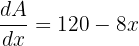
Set
 :
:

(c)
Compute the second derivative:

Since
is less than 0
x = 15 produces a maximum.
Evaluate the maximum area:

A closed storage box with a square base of side length  and height
  must have a total volume of
  .
.
(a) Show that the total external surface area of the box is given by
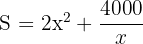 .
.
(b) Calculate the dimensions  and
and  that minimize the surface area.
(c) Prove that your dimensions give the minimum possible surface area.
(a)
The volume of a square-based box is:

The total surface area includes two square faces (top and bottom) and four rectangular sides:

Substitute
 :
:

(b)
Write  in index form:

Differentiate:

Set
 :
:

Find height :

The box is a cube with dimensions
 .
.
(c)
Compute the second derivative:

Substitute  :
:

Since  , the dimensions minimize the surface area.
The operating cost per hour, C (in pounds), for running a high-speed ferry at a constant speed of v km/h is given by:
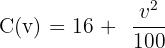
for v greater than 0.
The total journey distance is 100km.
(a) Show that the total cost of fuel for the 100km journey is:
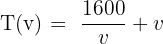 .
.
(b) Find the speed  that minimizes the total journey cost.
(c) Show that this speed produces a minimum cost, and state the cost.
(a)
Time  taken for the
  journey at speed :
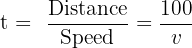
Total cost
 :
:

(b)
Write
 .
.
Differentiate with respect to :

Set
 :
:

(c)
Calculate the second derivative:
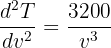
At  :
:

Since  ,
,  minimizes the cost.
Minimum total cost:

Find the absolute maximum and absolute minimum values of the function:

on the closed interval [0, 4]
To find the absolute extrema on a closed interval, compare values at internal stationary points with values at the endpoints  and
and  .
.
Step 1: Find internal stationary points

Set
 :
:

Stationary points occur at  and
and  (both lie within [0, 4]).
Step 2: Evaluate f(x) at all critical points and endpoints
Left Endpoint :

Stationary Point :

Stationary Point :

Right Endpoint :

Conclusion:
Absolute Maximum Value:  (attained at both and ).
Absolute Minimum Value:  (attained at both and ).
A Norman window consists of a rectangle of width 2x m and height y m, surmounted by a semicircle of radius x m. The total perimeter of the window frame is fixed at 12 m.
(a) Show that the total area  of the window can be written as:
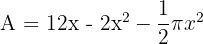
(b) Calculate the value of that maximizes the amount of light admitted through the window (the area), leaving your answer in exact form.
(c) Prove that your value of gives a maximum, and determine the exact corresponding height  .
.
The perimeter of the window consists of the base  , two vertical sides each of length , and the curved arc of the semicircle of radius :

Sum the boundary lengths to set up the perimeter constraint:

Rearrange to express in terms of :

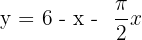
The total area is the sum of the rectangular area and the semicircular area:

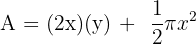
Substitute the expression for into the area formula:



(b) Differentiate and Solve for the Critical Value of
Differentiate with respect to :
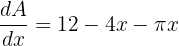
Factor out :
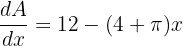
Set the derivative equal to zero to find the stationary point:


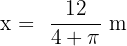
(c) Classify the Turning Point and Find
Find the second derivative of with respect to :

Since  :
:
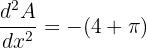 is less than 0
Because the second derivative is strictly negative for all values of , 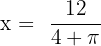 produces a maximum area.
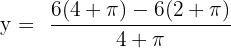
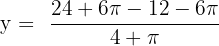
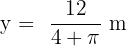
Substitute back into the formula for :

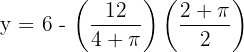
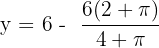
Combine over a common denominator:
Summarise with AI:
Did you like this article? Rate it!


 Loading...
I get it somehow, there are others who are unfamiliar and I have a hard time with it but it’s okay that I get it.
Thanks for sharing your thoughts! It’s completely normal to find some parts unfamiliar or more difficult than others. The important thing is that you’re making progress and understanding more as you practise. Keep going! 😊
At least I understood some of it, but there are others that I’m confused about and have a hard time understanding, but I get it.
Thanks for sharing! It’s great that you’ve understood some of it already. Don’t worry if a few parts are still confusing — keep practising and take your time with the trickier sections. You’ll get there! 😊
The lesson was a little difficult for me, especially the word problems, but the examples helped me understand it better.
Thanks for your feedback! Word problems can definitely be tricky, so we’re glad the examples helped make the lesson clearer. Keep practising — it gets easier with time! 😊
Thankyouuu po